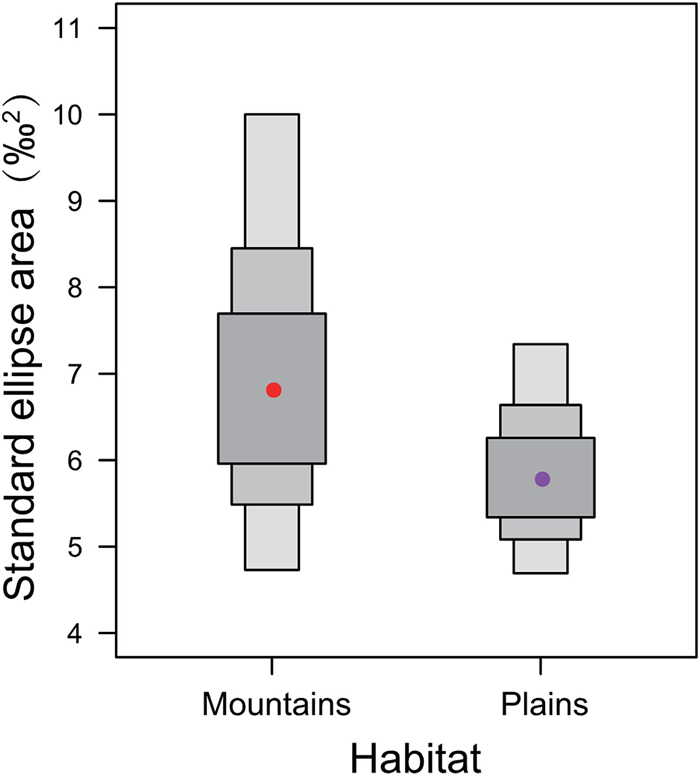
Density plot showing the mean Bayesian standard ellipse areas (dots) and their 50%, 75% and 95% confidence intervals (represented by boxes from dark grey to light grey) for wild Crested Ibis form mountains and plains.
Figures of the Article
-
![]() Map showing the geographicaldistribution of nest sites involved in eggshell membranes collection of the wild Crested Ibis in Yang County and Chenggu County, Hanzhong City, Shaanxi Province, central China.
Map showing the geographicaldistribution of nest sites involved in eggshell membranes collection of the wild Crested Ibis in Yang County and Chenggu County, Hanzhong City, Shaanxi Province, central China.
-
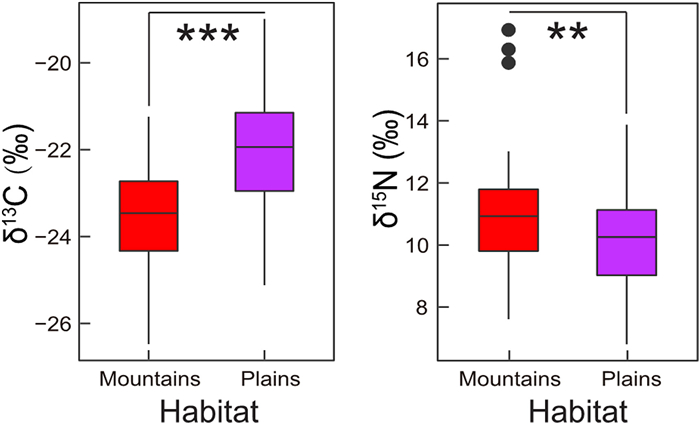
![]() Variation of δ13C (left) and δ15N (right) in eggshell membranes samples between mountains (red box) and plains (purple box). Significance between two habitat types are shown above the boxplot (***P < 0.001, **P < 0.05).
Variation of δ13C (left) and δ15N (right) in eggshell membranes samples between mountains (red box) and plains (purple box). Significance between two habitat types are shown above the boxplot (***P < 0.001, **P < 0.05).
-
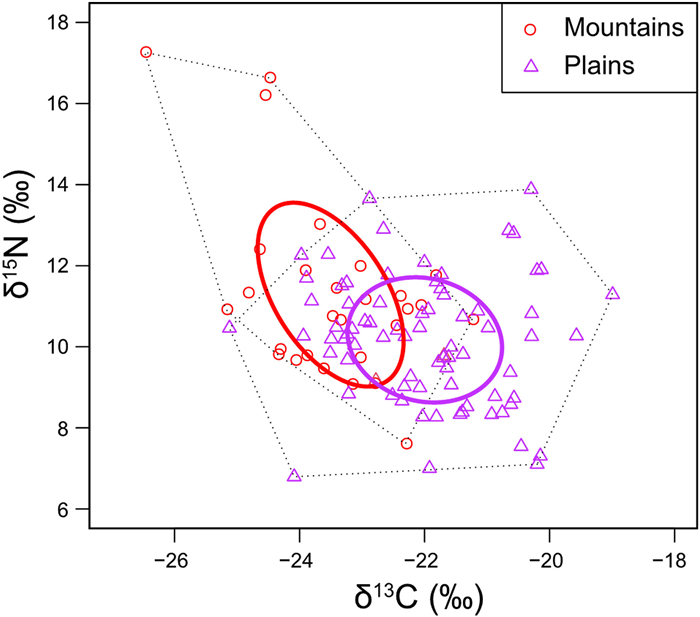
![]() Isotopic niches based on eggshell membrane samples for wild Crested Ibis from mountain (red circle) and plain (purple triangle) habitats. Solid bold lines (ellipses) represent corrected standard ellipse area (SEAc) showing the areas of isotopic niches. Black dotted lines represent the convex hull (total areas, TA) for all individuals. Each small circle and triangle represent the isotopic signature of a sample.
Isotopic niches based on eggshell membrane samples for wild Crested Ibis from mountain (red circle) and plain (purple triangle) habitats. Solid bold lines (ellipses) represent corrected standard ellipse area (SEAc) showing the areas of isotopic niches. Black dotted lines represent the convex hull (total areas, TA) for all individuals. Each small circle and triangle represent the isotopic signature of a sample.
-
![]() Density plot showing the mean Bayesian standard ellipse areas (dots) and their 50%, 75% and 95% confidence intervals (represented by boxes from dark grey to light grey) for wild Crested Ibis form mountains and plains.
Density plot showing the mean Bayesian standard ellipse areas (dots) and their 50%, 75% and 95% confidence intervals (represented by boxes from dark grey to light grey) for wild Crested Ibis form mountains and plains.
Related articles
-
2022, 13(1): 100063. DOI: 10.1016/j.avrs.2022.100063
-
2022, 13(1): 100044. DOI: 10.1016/j.avrs.2022.100044
-
2022, 13(1): 100036. DOI: 10.1016/j.avrs.2022.100036
-
2021, 12(1): 63. DOI: 10.1186/s40657-021-00300-6
-
2020, 11(1): 8. DOI: 10.1186/s40657-020-00193-x
-
2020, 11(1): 28. DOI: 10.1186/s40657-020-00214-9
-
2018, 9(1): 20. DOI: 10.1186/s40657-018-0112-y
-
2017, 8(1): 28. DOI: 10.1186/s40657-017-0086-1
-
2016, 7(1): 15. DOI: 10.1186/s40657-016-0050-5
-
2011, 2(2): 111-116. DOI: 10.5122/cbirds.2011.0017


 Download:


 Email Alerts
 RSS Feeds