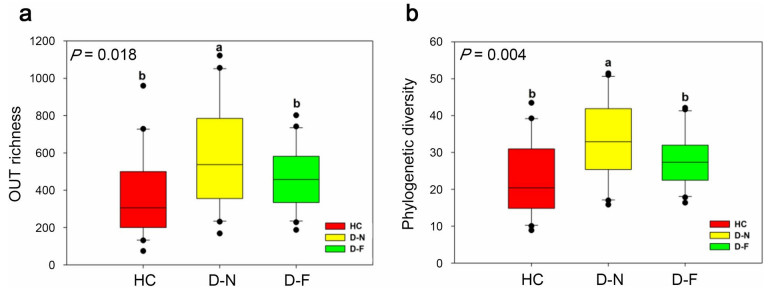
Gut bacterial alpha diversity (a OTU richness; b Phylogentic diversity) of HC, D-N and D-F. Different letters in the graphs represent significant differences from one-way ANOVA by Tukey's HSD comparisons (P < 0.05) and Kruskal-Wallis (P < 0.05); Bar represent means; error bars denote standard deviations. The one with the highest alpha diversity is marked as "a". The alpha diversity is compared with other values, and the difference is significant, marked as "b"
Figures of the Article
-
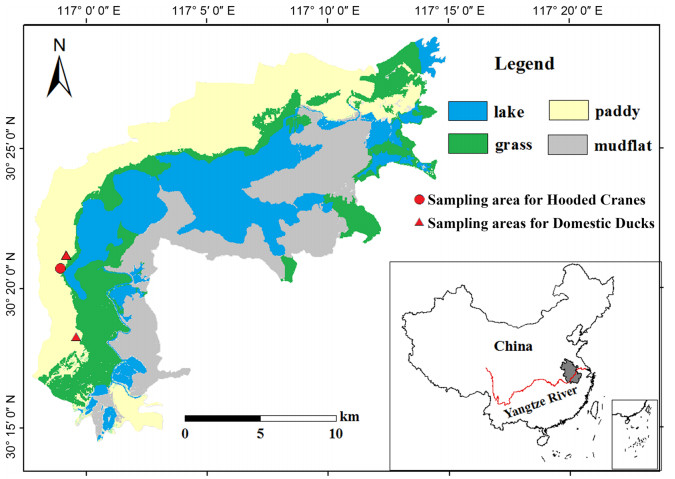
![]() Fecal sampling sites for the Hooded Cranes and Domestic Ducks at Shengjin Lake
Fecal sampling sites for the Hooded Cranes and Domestic Ducks at Shengjin Lake
-
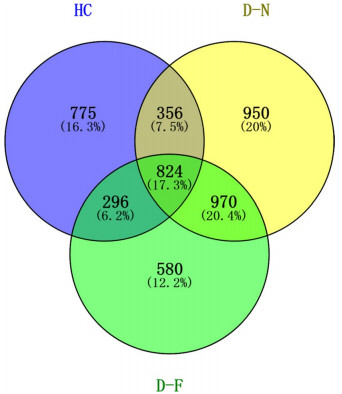
![]() Venn diagram showing the unique and shared intestinal bacterial operational taxonomic units (OTUs) among HC, D-N and D-F samples. HC Hooded Cranes, D-N Domestic Ducks in near areas, D-F Domestic Ducks in far areas. The explanation to the abbreviations apply also to Figs. 3–6
Venn diagram showing the unique and shared intestinal bacterial operational taxonomic units (OTUs) among HC, D-N and D-F samples. HC Hooded Cranes, D-N Domestic Ducks in near areas, D-F Domestic Ducks in far areas. The explanation to the abbreviations apply also to Figs. 3–6
-
![]() Gut bacterial alpha diversity (a OTU richness; b Phylogentic diversity) of HC, D-N and D-F. Different letters in the graphs represent significant differences from one-way ANOVA by Tukey's HSD comparisons (P < 0.05) and Kruskal-Wallis (P < 0.05); Bar represent means; error bars denote standard deviations. The one with the highest alpha diversity is marked as "a". The alpha diversity is compared with other values, and the difference is significant, marked as "b"
Gut bacterial alpha diversity (a OTU richness; b Phylogentic diversity) of HC, D-N and D-F. Different letters in the graphs represent significant differences from one-way ANOVA by Tukey's HSD comparisons (P < 0.05) and Kruskal-Wallis (P < 0.05); Bar represent means; error bars denote standard deviations. The one with the highest alpha diversity is marked as "a". The alpha diversity is compared with other values, and the difference is significant, marked as "b"
-
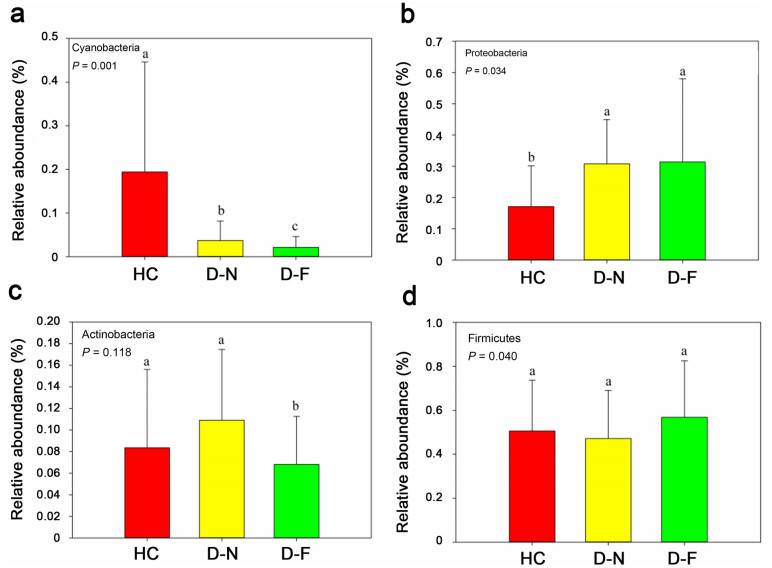
![]() Relative abundances of the dominant bacteria in the Hooded Crane and Domestic Duck samples. Bar represents means; error bars denote standard deviations; The lower case letters above error bar represents the statistically significant differences, as determined with the Kruskal-Wallis test (P < 0.05). The one with the highest alpha diversity is marked as "a". The alpha diversity is compared with other values, and the difference is significant, marked as "b". Significant with all three, marked as "c"
Relative abundances of the dominant bacteria in the Hooded Crane and Domestic Duck samples. Bar represents means; error bars denote standard deviations; The lower case letters above error bar represents the statistically significant differences, as determined with the Kruskal-Wallis test (P < 0.05). The one with the highest alpha diversity is marked as "a". The alpha diversity is compared with other values, and the difference is significant, marked as "b". Significant with all three, marked as "c"
-
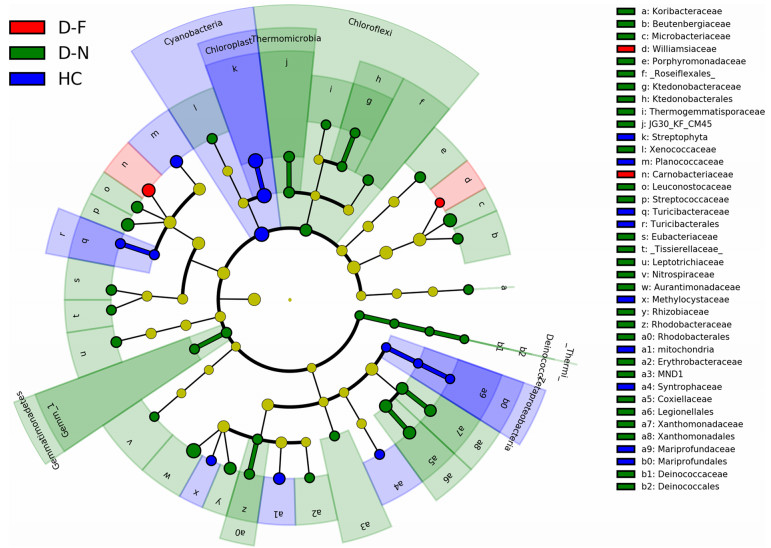
![]() LEfSe analysis (ranked by effect size LDA > 2, P < 0.05) of Hooded Crane gut bacteria across Hooded Cranes and Domestic Ducks present in near and far areas. The cladogram represents the taxonomic hierarchical structure of identified biomarkers among HC, D-N and D-F; blue, phylotypes overrepresented for HC; green, phylotypes overrepresented for D-N; and red, phylotypes overrepresented for D-F samples. Yellow color indicates that they are less significant among HC, D-N and D-F
LEfSe analysis (ranked by effect size LDA > 2, P < 0.05) of Hooded Crane gut bacteria across Hooded Cranes and Domestic Ducks present in near and far areas. The cladogram represents the taxonomic hierarchical structure of identified biomarkers among HC, D-N and D-F; blue, phylotypes overrepresented for HC; green, phylotypes overrepresented for D-N; and red, phylotypes overrepresented for D-F samples. Yellow color indicates that they are less significant among HC, D-N and D-F
-
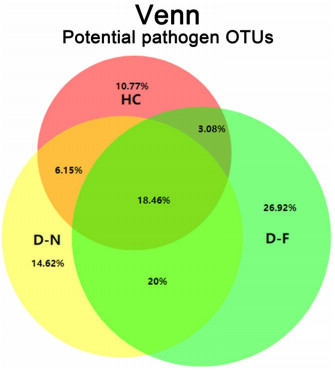
![]() Venn diagram indicating the shared and unique gut bacterial pathogenic operational taxonomic units (OTUs) among HC, D-N and D-F samples
Venn diagram indicating the shared and unique gut bacterial pathogenic operational taxonomic units (OTUs) among HC, D-N and D-F samples
Related articles
-
2023, 14(1): 100142. DOI: 10.1016/j.avrs.2023.100142
-
2023, 14(1): 100086. DOI: 10.1016/j.avrs.2023.100086
-
2022, 13(1): 100050. DOI: 10.1016/j.avrs.2022.100050
-
2021, 12(1): 1. DOI: 10.1186/s40657-020-00238-1
-
2020, 11(1): 13. DOI: 10.1186/s40657-020-00195-9
-
2015, 6(1): 16. DOI: 10.1186/s40657-015-0026-x
-
2015, 6(1): 15. DOI: 10.1186/s40657-015-0024-z
-
2015, 6(1): 11. DOI: 10.1186/s40657-015-0020-3
-
2014, 5(1): 6. DOI: 10.1186/s40657-014-0006-6
-
2013, 4(4): 281-290. DOI: 10.5122/cbirds.2013.0032


 Download:


 Email Alerts
 RSS Feeds