Anders Pape MØLLER, Johannes ERRITZØE, Jan Tøttrup NIELSEN. 2010: Causes of interspecific variation in susceptibility to cat predation on birds. Avian Research, 1(2): 97-111. DOI: 10.5122/cbirds.2010.0001
Citation:
Anders Pape MØLLER, Johannes ERRITZØE, Jan Tøttrup NIELSEN. 2010: Causes of interspecific variation in susceptibility to cat predation on birds. Avian Research, 1(2): 97-111. DOI: 10.5122/cbirds.2010.0001
Anders Pape MØLLER, Johannes ERRITZØE, Jan Tøttrup NIELSEN. 2010: Causes of interspecific variation in susceptibility to cat predation on birds. Avian Research, 1(2): 97-111. DOI: 10.5122/cbirds.2010.0001
Citation:
Anders Pape MØLLER, Johannes ERRITZØE, Jan Tøttrup NIELSEN. 2010: Causes of interspecific variation in susceptibility to cat predation on birds. Avian Research, 1(2): 97-111. DOI: 10.5122/cbirds.2010.0001
Generalist mammalian predators hunt for prey in different ways than raptors, often relying on ambush attack. Such differences in predator behavior can have profound effects on susceptibility of different species of prey to predation, but can also modify the behavior of prey. We investigated susceptibility of common birds to predation by domestic cats Felis catus, relying on an extensive data set on prey abundance and prey availability as determined by standardized bird counts. Susceptibility to cat predation for different species of birds was not significantly correlated with susceptibility to predation by sparrowhawk Accipiter nisus, but with susceptibility to goshawk Accipiter gentilis predation. Susceptibility to goshawk predation was independently predicted by susceptibility to cat and sparrowhawk predation. We cross-validated our estimate of susceptibility to cat predation by showing that the frequency of birds with tail loss increased strongly with susceptibility to cat predation. Male birds were disproportionately preyed upon, especially if having song posts low in the vegetation, and if having short flight distances when singing. Colonially breeding species were less susceptible to predation than solitary species. Bird species with high levels of innate immune defense against bacterial infections had high susceptibility to cat predation. These findings suggest that predation by cats has been an important selection pressure affecting anti-predation behavior, sexual display and immune function in common birds.
Small felids are some of the most abundant predators in undisturbed ecosystems before humans altered many habitats and their fauna (Ewer, 1973). The wild cat Felis silvestris silvestris and its African relative Felis silvestris lybica are the most common predators in the Palearctic, African and Oriental regions, with domesticated cats Felis silvestris catus now being dominant predators in man-made habitats around the world (Ewer, 1973). Although cats are among the most common pets, probably numbering hundreds of millions worldwide, there have been few attempts to assess their impact on prey populations and how prey has responded to this predation pressure.
Introduced predators constitute a major cause of extinction and disruption of ecosystem processes (Whittaker, 1998; Stattersfield and Capper, 2000). Domestic cats are a major cause of extinction through predation on mainly insular faunas, causing numerous cases of local and global extinctions (Whittaker, 1998; Stattersfield and Capper, 2000). For example, the only specimen ever recorded of the Stephen Island Wren Xenicus lyalli was taken by the lighthouse keeper's cat (Fuller, 2000). As such, any information on prey preferences by domestic cats may prove useful for predicting susceptibility to cat predation if cats are released.
Predators can have important indirect effects on prey populations (Lima and Dill, 1990; Abrams, 1991; Lima, 1998), by affecting the foraging behavior, condition and health status of prey and their offspring (Navarro et al., 2004; McNamara et al., 2005; Saino et al., 2005). Differences in behavior of predators may theoretically have significant effects on the condition of prey (McNamara et al., 2005). Therefore, different prey preferences of predators may have different impacts on prey populations, and shared prey preferences of different predators may render their common prey species particularly susceptible to predators, but also cause particularly strong reductions in population densities of prey. Surprisingly, there is currently only little empirical information on prey preferences by coexisting predators.
Prey is known to adjust their behavior to the preferences of predators (Curio, 1976; Caro, 2005). Numerous studies show that risky behavior changes following a predator attack, with a strong dependence on the condition of the individual. Many studies have also shown that males engaged in sexual display run a particular risk of falling prey to a predator (Zuk and Kolluru, 1998), although these studies have traditionally investigated this problem from the point of view of the prey. Thus, there is still little information about the risk that males of different species run in terms of increased susceptibility to a predator, and how such interspecific differences in risk affect the distribution of displaying individuals and the composition of displaying individuals in the community.
Prey preferences may be affected by health status of prey individuals. For example, Temple (1986) used a Red-tailed Hawk Buteo jamaicensis to show that prey had significantly elevated levels of parasitism compared to controls. Likewise, Hudson (1986) showed that incubating female Red Grouse Lagopus lagopus infected with helminths had significantly higher risk of mammalian predation than control individuals treated with an anti-helminthic drug. Furthermore, Snowshoe Hares Lepus americanus infected with nematodes had elevated risks of being killed by a predator, causing an interactive effect between nematode infection status and nutritional status on prey vulnerability (Murray et al., 1997). Møller and Erritzøe (2000) showed in a study of 18 species of passerine birds that had fallen prey to domestic cats Felis catus, which prey had significantly smaller spleens than control individuals, while no other phenotypic trait like size, condition or age differed between the two categories of individuals. Finally, Møller and Nielsen (2007) showed in a comparative study of prey of sparrowhawk Accipiter nisus and goshawk Accipiter gentilis that susceptibility to predation was strongly positively correlated with prevalence of infection with blood parasites. These studies emphasize the potential importance of parasitic infection for predator-prey interactions involving both avian and mammalian predators.
The objective of the present study was to quantify predation by cats on wild bird populations, by using quantitative information on relative abundance of prey and relative abundance of available prey. First, we assessed whether cats selected prey in the same way as two common avian predators, the sparrowhawk and the goshawk, by determining the correlation between their prey preferences. Second, we cross-validated our estimate of susceptibility to cat predation by testing whether bird species particularly susceptible to cat predation had evolved anti-predator adaptations such as loss of tail feathers that would allow prey to escape. Third, we tested if sexual display increased the risk of cat predation by determining the sex ratio of prey, the position in the vegetation where males were singing, and the flight distance of singing males relative to individuals engaged in other activities. Fourth, we tested if colonial prey species avoided cat predation through the vigilance of many individuals, while prey species exploiting closed habitats suffered elevated risk of cat predation. Finally, we tested if individuals in poor health state ran elevated risks of cat predation. We did that by investigating susceptibility to cat predation in relation to concentration of natural antibodies. We made these tests using our extensive field data for domestic cats on prey composition and abundance. Our study is unique by combining extensive data on susceptibility to three different predator species that use different tactics during prey capture.
Materials and methods
Study area
We quantified cat predation on birds in an area around Christiansfeld, Denmark during the period 1995–2009. Population density of breeding birds was recorded around Taps, Christiansfeld, Denmark, as described below.
Information on abundance of prey captured by raptors was recorded by one of us (JT Nielsen) for sparrowhawks during 21 years and for goshawks during 32 years in an area of 2417 km2 in Northern Denmark, as described below. Preferences for prey are consistent across large spatial scales as shown by similar preferences for the same prey species in Denmark and Finland (Huhta et al., 2003; Møller and Nielsen, 2006; AP Møller et al., unpublished results for goshawk).
One of us (AP Møller) recorded the frequency of tail-less individuals of birds around Brønderslev, Denmark and Orsay, France during 1990–2009 (Møller et al., 2006a). Information on height of song post positions was recorded around Brønderslev, Denmark during 1986–1989. Information on flight distance of birds when approached by a human was recorded around Brønderslev, Denmark and Orsay, France during 2006–2009 (Møller, 2008a, 2008b, 2008c; Møller et al., 2006b).
Susceptibility to cat predation
J Erritzøe received birds as a taxidermist and is obliged by law to record information on cause of death, date and locality for all specimens. Persons that brought specimens to J Erritzøe stated if a cat had killed a given specimen. This was often verified independently during preparation of the specimen using internal bite marks by cats as evidence. All specimens killed by cats were included in the present study.
We conducted standardized point counts (Bibby et al., 2005) to quantify the abundance of birds during the breeding season and the winter. In brief, point counts consist of 5 min being spent per point looking and listening for birds, while recording these, with 100 m between individual points. Total abundance during the breeding season was estimated as the sum of the seven annual point count censuses made between 2001 and 2006 during the breeding season between 25 May and 1 June. Two winter censuses were likewise conducted on 5 January 2005 and 5 January 2006. Total annual abundance of each species was estimated as the total of all summer observations plus the total of all winter observations. The results of these censuses are reported in the Appendix 1.
Appendix 1.
Summary information on avian prey species, number of prey individuals, susceptibility to cat predation, susceptibility to sparrowhawk predation, susceptibility to goshawk predation, frequency of tail loss (proportion of individuals without tails), coloniality (0 – solitary, 1 – colonial), habitat (0 – open grassland, 1 – shrub, 2 – forest), mean level of natural antibodies in adults (agglutination), song post height, mean flight distance (m) and body mass (g). See Material and methods for sources.
We estimated susceptibility to cat predation under the assumption that prey simply reflected their abundance as determined from the census data. Deviations from this null expectation would reflect preference if prey was relatively more common than expected from their abundance in the environment, while it would reflect avoidance if prey was relatively less common than expected from their abundance. We estimated prey susceptibility as the log10-transformed abundance of prey minus the log10-transformed expected number of prey based on the number of birds recorded during the bird censuses. Thus, if prey of a given species constituted 1% and available prey also constituted 1%, then the prey susceptibility index is 0. If prey of another species constituted 10% of all prey, but available prey constituted 1%, then the prey susceptibility index is 1.0.
Susceptibility to predation by raptors
We estimated the risk of predation by sparrowhawks and goshawks based on a total of 33647 prey items of 83 species of birds for the sparrowhawk and 17798 prey items of 79 species of birds for the goshawk, while other prey items were excluded because they were mammals, cage birds, or migrants. Prey remains of both raptors were systematically collected near nests (Nielsen, 2004; Møller and Nielsen, 2006), with only prey that we judged to have been left less than one month in the field being included. All nest sites were visited three times during each breeding season, and sampling effort can therefore be considered to be similar across sites. Here we calculated the expected number of prey by using information on abundance as prey relative to the breeding density of birds (Grell, 1998). Grell (1998) provides maps of the density of breeding birds based on systematic point counts of breeding birds carried out by hundreds of amateurs, allowing estimates of the mean density of breeding prey species in the study areas of Nielsen (2004). Such point counts provide reliable estimates of breeding bird density (Grell, 1998).
We estimated a logarithmic index of prey susceptibility as defined above for cat predation as the observed log10-transformed relative frequency of prey items found at nests minus the log10-transformed expected number of prey according to the bird census data. The expected number of prey according to abundance was estimated as the proportion of prey individuals of each species from the abundance based on point counts multiplied by the total number of prey individuals.
Frequency of tail-less birds
We recorded the frequency of complete loss of tail feathers from birds as an estimate of successful escape from a predation event near Brønderslev, Denmark 1990–2009 and Orsay, France 1999–2009. Every time a bird was seen, we recorded whether it had or did not have a tail, and this was recorded until a minimum sample had been obtained. See Møller et al. (2006a) for further details.
Breeding sociality
We classified the species as being solitary or colonial breeders using information obtained from the social organization sections in Cramp and Perrins (1977–1994). Basically, species with large, multi-purpose breeding territories that contained nest site, food and shelter were classified as solitary, while species with small, aggregated territories that only contained nest sites were classified as colonial.
Breeding habitats
We scored habitats as open grassland (a score of 1), bushes (a score of 2), or trees (a score of 3), relying on information in Cramp and Perrins (1977–1994).
Natural antibodies
Natural antibodies constitute important and stable component of innate immunity that acts as a first line of defense against bacterial infection (Reid et al., 1997; Ochsenbein et al., 1999), and circulating levels thus do not rely on exposure to antigens for production. Blood was collected from adult birds captured during the breeding seasons 2005–2006 in study sites around Brønderslev, Denmark by puncturing the brachial vein and collecting two heparinized capillaries of 75 μL blood that were stored in a cooling box at a temperature just above freezing. In the lab within a period of 2 h we centrifuged the capillaries for 10 min at 4000 r·min−1. Plasma and cells were separated and stored at −20℃ until analysis at the lab.
To estimate the levels of circulating natural antibodies we used the procedure developed by Matson et al. (2005) and adjusted by Møller and Haussy (2007). The agglutination part of the assay estimates the interaction between natural antibodies and antigens in rabbit blood, producing blood clumping. Quantification of agglutination is achieved by serial dilution in polystyrene 96-well assay plates, with the dilution step at which the agglutination reaction is stopped. We used fresh rabbit blood with Alsever's anticoagulant, 96 round well assay plates and an EPSON 4490 photo scanner that was set at professional mode, with document type color film, 48 bit color and 300 dpi. Whole rabbit blood was stored at 4℃. After determination of the level of haematocrit, we diluted to obtain a solution of 1% erythrocytes.
The protocol for hemagglutination was as follows. The plasma samples were thawed and homogenized using a vortex. Subsequently 25 mL of plasma was pipetted into each column, followed by addition of 25 mL of the solution in all wells. Subsequent wells contained a solution diluted by a factor two from a solution of one in two in the first well to a solution of one in 2048 in the 11th well. Well number 12 only contained the dilution of erythrocytes, thus serving as a negative control. Subsequently 25 mL of the 1% solution of rabbit blood was added to all wells. The assay plate was then covered and shaken for 10 s, followed by incubation for 90 min in a bath at 37℃. The assay plate was then removed from the bath at left at an inclination of 45° at ambient temperature for 20 min. The assay plate was then read and scanned. Scoring was based on negative wells having a small round agglutinate at the bottom thus forming a well-defined red round point, and positive wells having a diffuse film at the bottom. See Møller and Haussy (2007) for further details of procedures.
Song posts
We estimated song post exposure by determining the height of the song post of common passerine birds during 1986–1989 relative to the surrounding vegetation or structures such as buildings. We systematically noted the height of all song posts recorded during March–August whenever in the field. We only considered the vegetation within a distance of 2 m from the singing bird. In brief, song post exposure is estimated as the percentage of all song posts of a given species that are at a height above the surrounding vegetation, ranging from 0 when all song posts are lower than the surrounding vegetation to 100 when all song posts are above the vegetation. The number of observations on which each of these estimates for a different species was based ranged from 28 to 500 song posts. This method for describing song posts was first developed by Scherrer (1972), who reported quantitative information for 34 common species. There was a high degree of consistency in song post exposure between the study by Møller et al. (2006a) and that of Scherrer (1972).
Flight distances
Regularly during February–September 2006–2009 we estimated flight distances for birds, using a standardized technique in Orsay, France and Brønderslev, Denmark. In brief, when an individual bird had been located with a pair of binoculars, the observer moved at a normal walking speed towards the individual, while recording the number of steps (which approximately equals the number of meters measured with a laser-based hypsometer (Møller et al., 2008)). The distance at which the individual took flight was recorded as the flight initiation distance, while the starting distance was the distance from where the observer started walking up to the position of the bird. If the individual was positioned in the vegetation, the height above ground was recorded to the nearest meter. Flight initiation distance was estimated as the Euclidian distance, which equals the square root of the sum of the squared horizontal distance and the squared height above ground level (Blumstein, 2006).
All recordings were made during the breeding season, when most individuals are sedentary, thus preventing the same individual from being recorded in different sites.
Flight initiation distance was consistent for the same species in different studies, as shown by three different cross-validations (Møller, 2008a, 2008b, 2008c). Previous studies have shown that starting distance is strongly positively correlated with flight initiation distance (Blumstein, 2003, 2006; Cooper, 2005, 2008), thereby causing a problem of collinearity. We eliminated this problem of collinearity by searching habitats for birds with a pair of binoculars when choosing an individual for estimating flight initiation distance. In this way we assured that almost all individuals were approached from a distance of at least 30 m, thereby keeping starting distances constant across species. Flight initiation distance was negatively related to starting distance in a model that included species, age, habitat, country and body mass as factors (F1, 4188 = 37.97, P < 0.0001), only explaining 1% of the variance. None of the results presented in this paper changed statistically when including starting distance as an additional variable.
Body mass
We recorded body mass to the nearest 0.1 g for all specimens studied.
Statistical analyses
We estimated a logarithmic susceptibility index to quantify likelihood for individuals of a given species to be killed by cats, as log10-transformed relative number of individuals of a given species killed by cats minus log10-transformed ((number of individuals observed of that species divided by the total number of individuals of all species) multiplied by the total number of individuals killed by cats). To avoid problems with species having an abundance of cat kills or an overall abundance of zero, we added one to all observations.
Comparative analyses
We controlled for similarity in frequency of individuals killed by cats among different bird species due to common ancestry by calculating standardized independent linear contrasts (Felsenstein, 1985), using the computer program CAIC (Purvis and Rambaut, 1995). Standardization of contrast values was checked by examination of absolute values of standardized contrasts versus their standard deviations (Garland et al., 1992). Plotting the resulting contrasts against the variances of the corresponding nodes revealed that these transformations made the variables suitable for regression analyses. In cases where extreme residuals were recorded, we tested for the robustness of the conclusions by excluding contrasts with studentized residuals greater than 3.00 (Jones and Purvis, 1997). Likewise, we ranked the independent variable to test if the conclusions remained unchanged (Møller and Birkhead, 1994), and in no case did this procedure give rise to conclusions different from those obtained with the contrast values. Ranking provides a very conservative test of the hypothesis under test, and robustness of findings to ranking of the independent variable thus suggests that distributions of variables are not a confounding factor leading to specific conclusions.
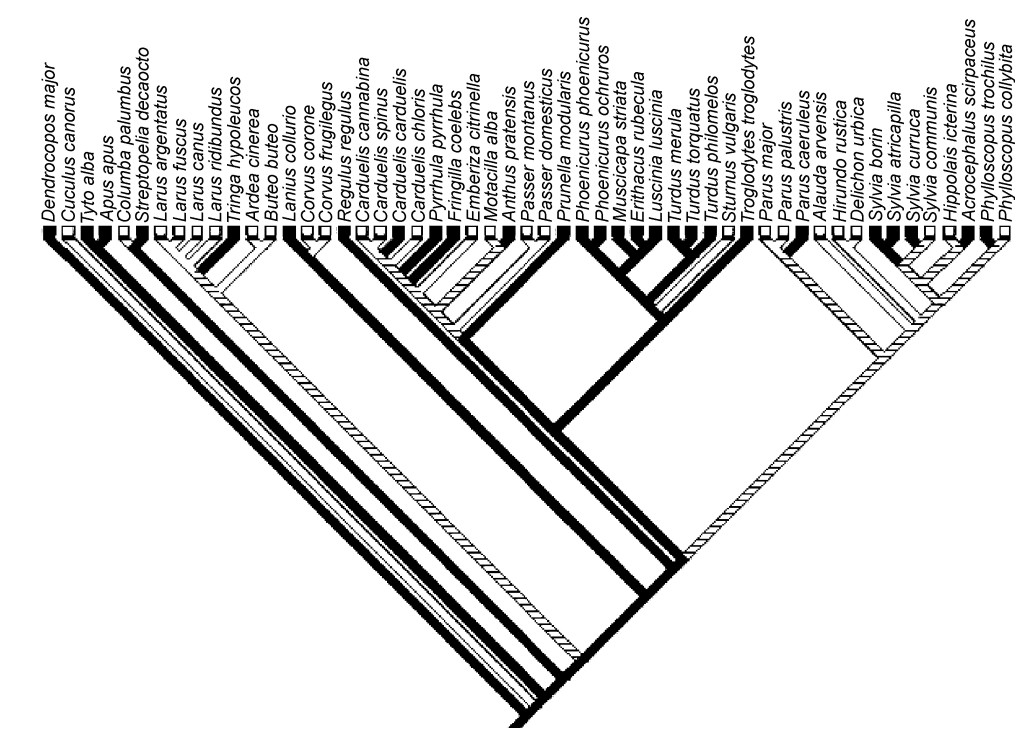
We constructed a composite phylogeny of the 53 species investigated here, mainly based on information in Sibley and Ahlquist (1990), combined with information from more recent sources (Blondel et al., 1996; Helbig and Seibold, 1999; Barker et al., 2001; Barker et al., 2004) (Fig. 1). Because this composite phylogeny was derived from different studies using different phylogenetic methods and different molecular markers, consistent estimates of branch lengths were unavailable. Therefore, we considered branch lengths to be equal in the analyses (this is equivalent to an assumption of a punctuated model of evolution (Purvis and Rambaut, 1995)).
Figure
1.
Phylogenetic relationships between bird species and susceptibility to cat predation. Note that a high level of susceptibility (black lines, indicating a susceptibility value above the median) to cat predation was the ancestral state that has unequivocally been lost four times. White lines are low levels of susceptibility, while hatched lines refer to equivocal states of susceptibility.
Regressions of standardized linear contrasts were forced through the origin because the comparative analyses assume that there has been no evolutionary change in a character when the predictor variable has not changed (Purvis and Rambaut, 1995). We used multiple regression to find the best-fit model, using the software JMP (2000). There was no evidence of high levels of collinearity between variables (Tabacknik and Fidell, 1996).
We used MacClade 4.03 (Maddison and Maddison, 2001) to re-construct ancestral state for susceptibility to cat predation. This was done using strict parsimony by dichotomizing the predation variable by assigning species with values above the median a value of 1 and all other species a value of 0. The ancestral state of susceptibility to predation, and the minimum number of transitions from the ancestral state to the other state, were subsequently recorded, using the phylogenetic hypothesis listed above.
Information was missing for some species for certain variables, causing sample sizes to differ slightly among analyses.
Values reported are means (SE).
Results
Distribution of susceptibility to cat predation
This study was based on 132 cases of cat predation on 53 species of birds, of which 45 were successfully preyed upon. The index of susceptibility to cat predation was on average 0.13 (SE = 0.05), being significantly larger than zero (one-sample t-test, t = 2.40, df = 52, P = 0.020). The index of susceptibility to cat predation ranged from –1.00 (a factor ten less often than expected from abundance, house sparrow Passer domesticus) to +1.04 (a factor eleven greater than expected from abundance, blackcap Sylviaatricapilla). The distribution of the susceptibility index did not differ significantly from a normal distribution (Shapiro-Wilk W-test, W = 0.98, P = 0.82).
The ancestral state for the dichotomized variable reflecting susceptibility to predation was a high level of susceptibility above the median for the 53 species (Fig. 1). There were four unambiguous transitions from high to low susceptibility to cat predation, while there were no unequivocal transitions from low to high susceptibility (Fig. 1).
Susceptibility to predation by different predators
Susceptibility to cat predation was not significantly correlated with susceptibility to sparrowhawk predation (analysis of species-specific data: F = 0.94, df = 1, 39, P = 0.34; analysis of contrasts: F = 0.29, df = 1, 39, P = 0.59) or goshawk predation (analysis of species-specific data: F = 0.15, df = 1, 33, P = 0.70; analysis of contrasts: F = 0.33, df = 1, 33, P = 0.57). However, when body mass and body mass squared were entered as additional variables, to account for the fact that there might be an optimal body size for preferred prey, there were positive relationships between susceptibility to predation by cats and goshawks, but not between cats and sparrowhawks in analyses of species-specific data (sparrowhawk: F = 1.28, df = 1, 36, P = 0.26, slope (SE) = –0.18 (0.16); goshawk: F = 33.36, df = 1, 31, P < 0.0001, slope (SE) = 0.80 (0.14)) and contrasts (sparrowhawk: F = 0.19, df = 1, 37, P = 0.67, slope (SE) = –0.07 (0.16); goshawk: F = 4.75, df = 1, 31, P = 0.037, slope (SE) = 0.44 (0.20)). Likewise, there was a positive relationship between susceptibility to goshawk and sparrowhawk predation after controlling for body mass and body mass squared (species-specific data: F = 7.73, df = 1, 23, P = 0.011, slope (SE) = 0.34 (0.12); contrasts: F = 8.93, df = 1, 23, P = 0.0066, slope (SE) = 0.71 (0.24)). Susceptibility to cat predation and sparrowhawk predation independently predicted susceptibility to goshawk predation both in analyses of species-specific data and contrasts (Table 1). In contrast, only susceptibility to goshawk predation, but not to cat predation predicted susceptibility to sparrowhawk predation in a model that also included body mass and body mass squared (goshawk: F = 8.56, df = 1, 22, P = 0.0078, slope (SE) = 0.50 (0.17); cat: F = 1.73, df = 1, 22, P = 0.20, slope (SE) = –0.21 (0.16)).
Table
1.
Susceptibility to goshawk predation in relation to susceptibility to cat and sparrowhawk predation, body mass and body mass squared in different prey species of birds
Variable
Sum of squares
df
F
P
Slope (SE)
Species:
Cat predation
3.54
1
23.99
< 0.0001
0.59 (0.12)
Sparrowhawk predation
1.26
1
8.56
0.0078
0.56 (0.19)
Body mass
14.11
1
95.57
< 0.0001
2.86 (0.29)
Body mass squared
0.41
1
2.76
0.11
–0.81 (0.49)
Error
3.25
22
Contrasts:
Cat predation
0.32
1
9.76
0.0049
0.39 (0.13)
Sparrowhawk predation
0.30
1
9.36
0.0058
0.62 (0.20)
Body mass
1.18
1
36.14
< 0.0001
2.40 (0.40)
Body mass squared
0.01
1
0.33
0.57
0.97 (1.69)
Error
0.72
22
The two models had the statistics F = 34.89, df = 4, 22, r2 = 0.86, P < 0.0001 and F = 10.95, df = 4, 22, r2 = 0.33, P < 0.0001.
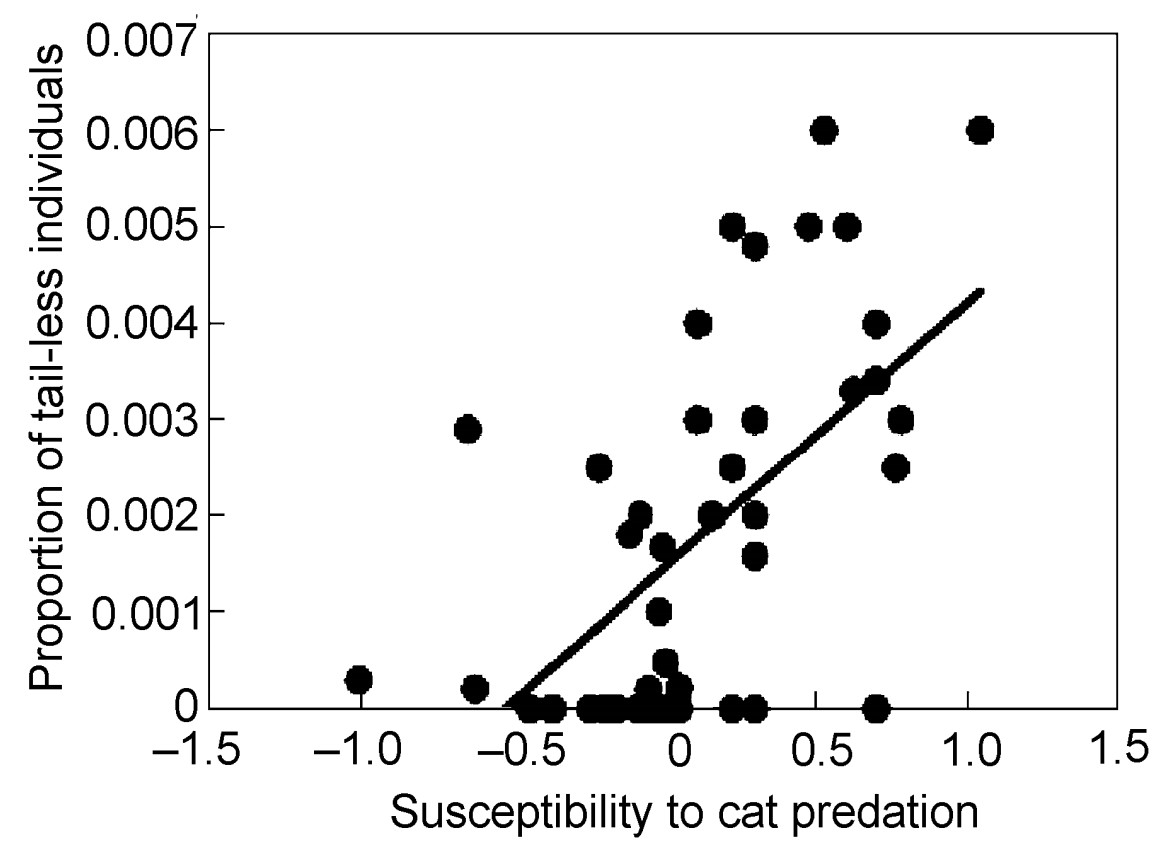
If the estimates of susceptibility to cat predation were reliable, we should expect them to correlate with other measures of predation risk. Indeed, the frequency of tail-less individuals increased strongly with susceptibility to cat predation as reflected by the relative abundance of prey in relation to the relative abundance of available prey (Fig. 2; F = 19.34, df = 1, 51, r2 = 0.27, P < 0.001, slope (SE) = 0.037 (0.008)). An analysis of contrasts revealed a similar conclusion (F = 17.75, df = 1, 51, r2 = 0.26, P = 0.0001, slope (SE) = 0.019 (0.004)). This effect remained after inclusion of body mass and coloniality in the model (F = 6.95, df = 1, 49, r2 = 0.12, P = 0.011, slope (SE) = 0.023 (0.009)). Finally, an analysis of contrasts, controlling for effects of body mass, showed a strong negative relationship between tail loss and susceptibility to cat predation (F = 12.00, df = 1, 50, r2 = 0.19, P = 0.0011, slope (SE) = 0.018 (0.005)).
Figure
2.
Proportion of tail-less individuals in different species of birds in relation to susceptibility to cat predation. The line is the linear regression line.
Susceptibility to cat predation, body size, sexual dichromatism and song behavior
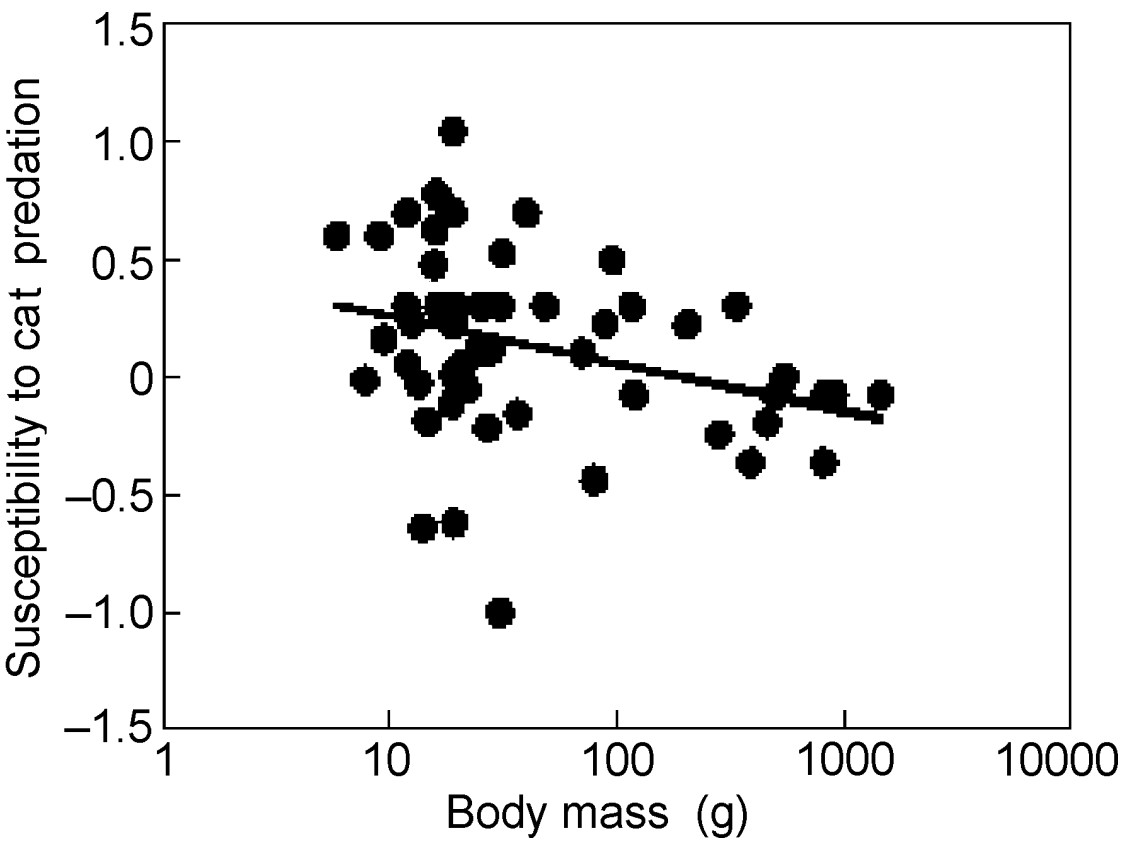
Susceptibility to cat predation decreased with increasing body mass of birds (Fig. 3; F = 5.82, df = 1, 51, r2 = 0.10, P = 0.020, slope (SE) = –0.201 (0.083)), while there was no significant additional quadratic effect of body mass (F = 0.04, df = 1, 50, r2 = 0.000, P = 0.85). There was also an effect of body mass in an analysis of contrasts (F = 20.03, df = 1, 51, r2 = 0.28, P < 0.0001, slope (SE) = –1.072 (0.239)).
Figure
3.
Susceptibility to cat predation in relation to body mass (g) in different species of birds. The line is the linear regression line.
Among the 132 prey individuals, there were 111 males (84%), differing significantly from an even sex ratio (log-likelihood ratio test, G = 72.10, df = 1, P < 0.0001). The proportion of males in the 45 species was on average 0.84 (SE = 0.05), differing significantly from 0.5 (one-sample t-test, t = 11.59, df = 44, P < 0.0001).
There was no significant difference in susceptibility to cat predation depending on sexual dichromatism (F = 0.71, df = 1, 53, P = 0.40, monochromatic: –0.28 (0.08), n = 33; dichromatic: –0.42 (0.17), n = 22).
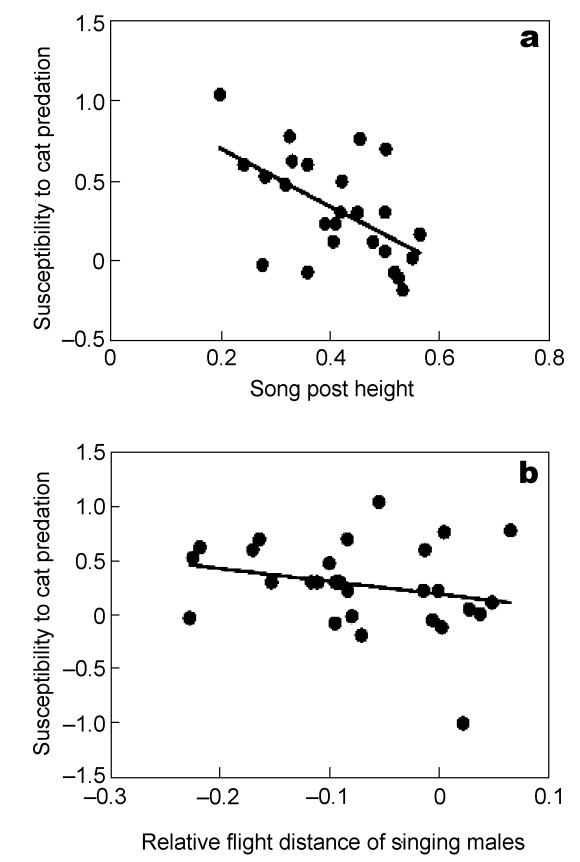
Birds that sang from positions well above the ground were less susceptible to cat predation than birds that sang from relatively lower song posts (Fig. 4a; F = 15.90, df = 1, 39, r2 = 0.29, P = 0.0003, slope (SE) = –1.108 (0.278)). That was also the case in an analysis of contrasts (F = 4.98, df = 1, 39, r2 = 0.11, P = 0.031, slope (SE) = –1.219 (0.546)). This effect was independent of body mass (partial effect for song post position: F = 16.54, df = 1, 38, r2 = 0.30, P = 0.0002, slope (SE) = –1.110 (0.273)).
Figure
4.
Susceptibility to cat predation in relation to (a) song post height and (b) relative flight distance of singing individuals in different species of birds. The lines are the linear regression lines.
Singing birds differed in flight distance from non-singing individuals, and this difference varied significantly with susceptibility to cat predation (Fig. 4b; F = 13.75, df = 1, 39, r2 = 0.26, P = 0.0006, slope (SE) = –1.199 (0.323)). This was also the case in an analysis of contrasts (F = 14.71, df = 1, 39, r2 = 0.27, P = 0.0004, slope (SE) = –1.894 (0.494)). Thus, bird species that were more susceptible to cat predation had shorter flight distances when singing relative to other activities than did bird species that were less susceptible to predation than expected by chance. A model that included song post position, flight distance and body mass did not show a significant effect for flight distance (F = 3.46, df = 1, 37, r2 = 0.09, P = 0.071), but did retain a significant effect for song post position (F = 7.10, df = 1, 37, r2 = 0.16, P = 0.011, slope (SE) = –0.819 (0.307)). An analysis of contrasts showed a significant effect of flight distance, but not for song post position (flight distance: F = 5.51, df = 1, 37, r2 = 0.13, P = 0.024, slope (SE) = –1.356 (0.578); song post height: F = 0.16, df = 1, 37, r2 = 0.00, P = 0.69).
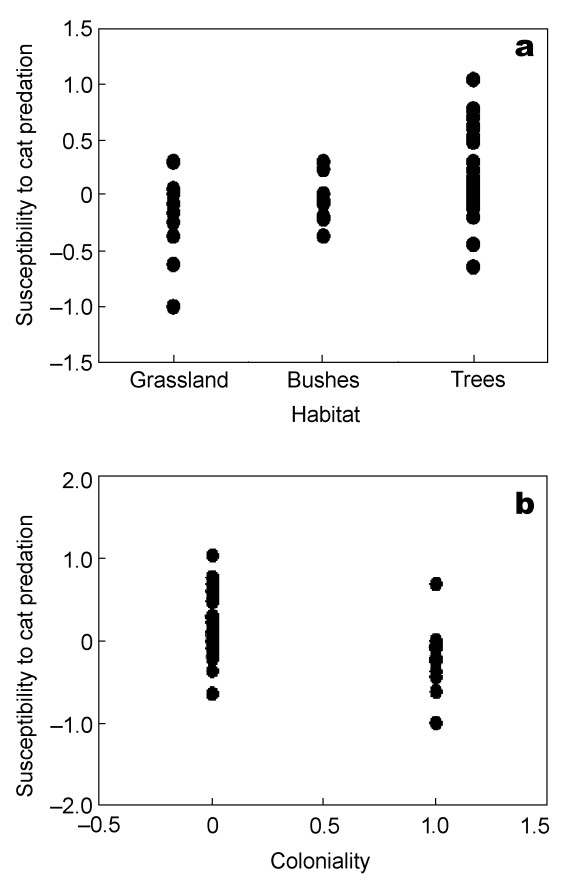
Susceptibility to cat predation, habitat and social environment
Bird species living in habitats with bushes and especially in forested areas were more susceptible to cat predation than species living in open habitats (Fig. 5a; F = 9.60, df = 1, 51, r2 = 0.16, P = 0.0032, slope (SE) = 0.180 (0.058)). However, that was not the case in an analysis of contrasts (F = 1.75, df = 1, 51, r2 = 0.03, P = 0.19).
Figure
5.
Susceptibility to cat predation in relation to (a) habitat and (b) coloniality in different species of birds. The lines are the linear regression lines.
Bird species that were colonial were less susceptible to cat predation than solitarily breeding bird species (Fig. 5b; F = 13.60, df = 1, 51, r2 = 0.21, P = 0.0006, slope (SE) = –0.431 (0.117)). An analysis of contrasts also revealed a significant effect (F = 5.55, df = 1, 51, r2 = 0.10, P = 0.022, slope (SE) = –0.622 (0.264)). The effect of habitat described above was mainly caused by coloniality (coloniality: F = 6.96, df = 1, 50, r2 = 0.12, P = 0.011, slope (SE) = –0.333 (0.126); habitat: F = 3.44, df = 1, 50, r2 = 0.06, P = 0.070, slope (SE) = 0.112 (0.061)). An analysis of contrasts revealed a significant effect of coloniality, but not of habitat (coloniality: F = 5.37, df = 1, 50, r2 = 0.10, P = 0.025, slope (SE) = –0.609 (0.263); habitat: F = 1.65, df = 1, 50, r2 = 0.03, P = 0.21, slope (SE) = 0.163 (0.127)).
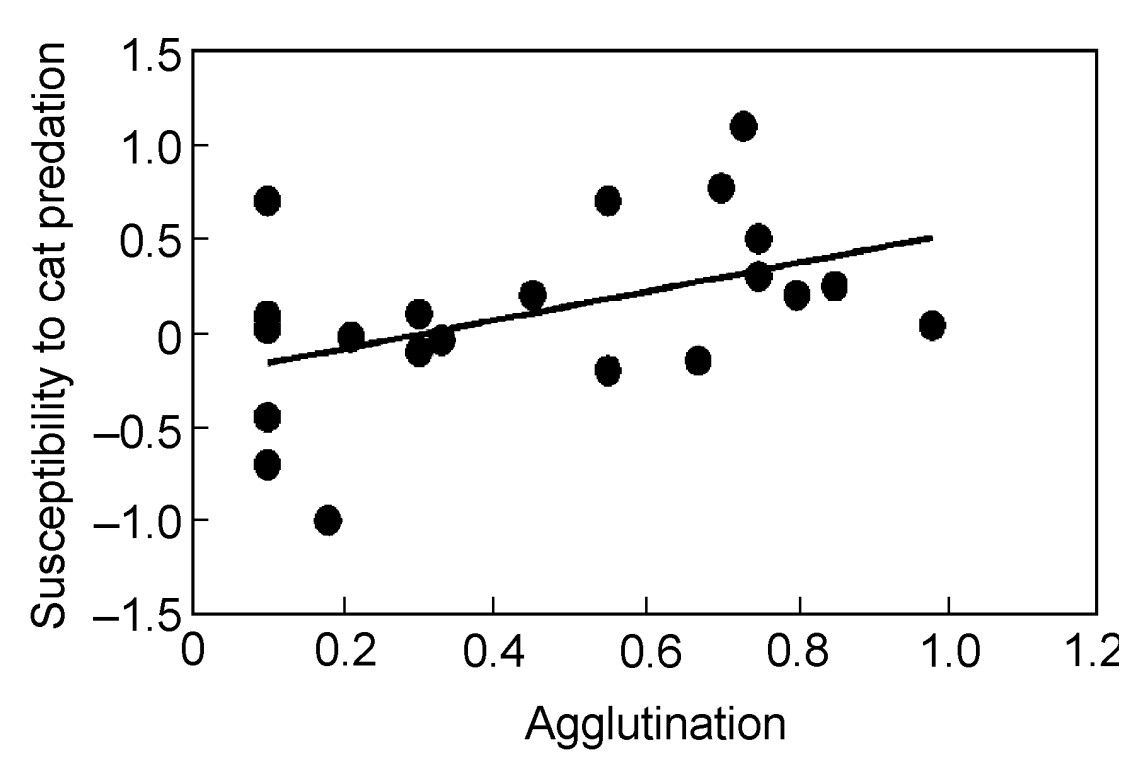
Susceptibility to cat predation and innate immunity
Bird species with strong agglutination in adults had high susceptibility to cat predation (Fig. 6; analysis weighted by log-transformed sample size: F = 9.53, df = 1, 21, r2 = 0.31, P = 0.0056, slope (SE) = 0.885 (0.287)). This relationship was also present in an analysis of contrasts (analysis weighted by log-transformed sample size: F = 4.83, df = 1, 21, r2 = 0.19, P = 0.039, slope (SE) = 1.280 (0.582)). In contrast, the relationship between agglutination and susceptibility to cat predation was not present in nestlings (analysis weighted by log-transformed sample size: F = 0.33, df = 1, 23, r2 = 0.01, P = 0.57). Finally, the effect of agglutination on susceptibility to cat predation was independent of body mass (analysis weighted by log-transformed sample size: F = 8.96, df = 1, 20, r2 = 0.31, P = 0.0072, slope (SE) = 0.884 (0.295)).
Figure
6.
Susceptibility to cat predation in relation to agglutination in adult individuals in different species of birds. The line is the linear regression line.
The main results of this study of bird predation by domestic cats were that susceptibility to cat predation differed by more than a factor twenty among common species of birds. Susceptibility to cat predation was strongly positively correlated with susceptibility to goshawk predation, but not to susceptibility to sparrowhawk predation. There was a strong male bias in cat prey, with prey species characterized by singing close to the ground and having short flight distances when singing being particularly susceptible to cat predation. Bird species living socially had markedly reduced probability of falling prey to cats, and this reduction was greater in open habitats without bushes and trees. Finally, cat predation may have been disproportionately directed towards potential prey in poor health because a measure of innate immunity was positively correlated with susceptibility to cat predation.
We analyzed susceptibility to cat predation in different species of birds, showing in phylogenetic analyses based on 53 species that the ancestral state was a high level of susceptibility (above the median value). Subsequently, four lineages of birds have experienced a transition from high to low susceptibility, while there have been no transitions in the opposite direction. We analyzed susceptibility to three different species of sympatric predators; domestic cats and two species of raptors. If different predators attack potential prey in the same way, susceptibility should be similar, especially if population density of prey is similar, as for sympatric predators. Cats mainly rely on ambush attacks on their prey in shrub or forest (Ewer, 1973), and that also applies to the goshawk (Cramp and Perrins, 1980). In contrast, the sparrowhawk is an agile and active predator that regularly chases its prey in open habitats (Cramp and Perrins, 1980). Therefore, we should expect susceptibility to cat predation to be positively related to susceptibility to goshawk predation, but not to sparrowhawk predation. Indeed, that is what we found. Closer inspection revealed that susceptibility to goshawk predation was independently predicted by susceptibility to predation by both sparrowhawks and cats, while susceptibility to sparrowhawk predation was only significantly predicted by susceptibility to goshawk predation, but not to cat predation. Therefore, we can conclude that cats and goshawks exploit similar prey, especially when removing the effects of body size of prey. Sparrowhawks and goshawks also exploit similar prey, but cats and sparrowhawks show no similarity in prey preferences. These differences have important implications for direct and indirect effects of predation by these different predators on prey (McNamara et al., 2005).
Cats caught a disproportionate fraction of males, with 84% of all prey being males. We found evidence of this predation being linked to risky male sexual display. First, song posts used by males predicted susceptibility to cat predation, with the most exposed species having males positioned low in the vegetation being particularly susceptible. Møller et al. (2006b) have previously shown that susceptibility of birds to predation by the sparrowhawk increases with song post exposure. Therefore, singing males are confronted with a potential trade-off, by either singing at high positions in the vegetation and running the risk of falling prey to a sparrowhawk, or singing at low positions in the vegetation while running the risk of being eaten by a cat. Second, relative flight distance of singing males compared to non-singing individuals also predicted susceptibility to cat predation, with males with relatively short flight distances being particularly susceptible. Møller et al. (2008) have previously shown that birds with relatively short fight distances for their body size being disproportionately susceptible to predation by sparrowhawks. Therefore, the present study extends this finding by suggesting that risk-taking behavior by singing males, as reflected by their relative flight distance when singing compared to other activities, is another factor contributing to risk of predation. Huhta et al. (2003) and Møller and Nielsen (2006) showed that males with bright sexual plumage coloration were particularly susceptible to sparrowhawk predation, and the present study therefore extends this finding by showing that not only visual display, but also behavior associated with vocal display renders particular species susceptible to cat predation. Such observations are rare in the literature (see Mougeot and Bretagnolle (2000) for an exception). This finding may have implications for interspecific variation in the reliability of sexual signals, and for the intensity of sexual selection due to extreme skew in the sex ratio of prey. In other words, predation by domestic cats may increase the variance in male mating success by elimination of a significant proportion of male birds.
Predators can have strong impact on the evolution of anti-predator adaptations, but also indirectly on the composition of populations of prey (Abrams, 1991; Lima, 1998; Caro, 2005). Prey species preferred by cats were also species with a high frequency of tail loss, showing evidence of a non-negligible frequency of successful escape from attempted cat predation. Indeed, a previous study of tail loss in birds suggested that species that are commonly subject to predation have evolved particularly loose feathers that would facilitate successful escape from a predator (Møller et al., 2006a) in much the same way as autotomy has evolved as a means of escape from predators in lizards and many other taxa (Cooper et al., 2004). Colonial bird species were less susceptible to cat predation than solitary species, possibly through an effect of vigilance by many different individuals (Caro, 2005). This result might have repercussions for which bird species are successful colonizers of man-made habitats with high densities of cats.
Predation often affects individuals in poor health (Hudson, 1986; Temple, 1986; Murray et al., 1997; Møller and Erritzøe, 2000; Møller and Nielsen, 2007). Here we found evidence consistent with this hypothesis because bird species with strong innate immunity, as reflected by high mean agglutination, were particularly susceptible to cat predation. Constitutive innate immunity represents the first line of defense against parasite attack through natural anti-bodies. Given that innate immunity constitutes a first line of defense against bacterial infection (Reid et al., 1997; Ochsenbein et al., 1999), and that strong immune defense has evolved to cope with virulent parasites (Hochberg and van Baalen, 1998), the positive correlation between susceptibility to cat predation and agglutination is indicative of prey species particularly susceptible to predation also having strong immunity and hence suffering regularly from bacterial infections.
The present study identified a number of unique predictors of susceptibility to cat predation. These predictors may constitute important information for future analyses of indirect, non-lethal effects of predation on prey populations. They may also be of importance when analyzing the impact of domestic cats on natural populations of birds such as those on islands (Whittaker, 1998).
In conclusion, we have shown that different prey species differ in their susceptibility to predators, but also that some predators affect prey species in a similar way. Cat predation differentially affected males, mainly through song post choice and flight distance during singing. Preferred prey could partly avoid risk of cat predation by living in social aggregations, open habitats and by readily losing their tail feathers during attack. A positive correlation between susceptibility to cat predation and innate immunity suggested that cats differentially target prey species that suffer from bacterial infections.
Abrams PA. 1991. Strengths of indirect effects generated by optimal foraging. Oikos, 62:167–176.
Barker FK, Barrowclough GF, Groth JG. 2001. A phylogenetic hypothesis for passerine birds: Taxonomic and biogeographic implications of an analysis of nuclear DNA sequence data. Proc R Soc Lond B, 269:295–308.
Barker FK, Cibois A, Schikler P, Feinstein J, Cracraft J. 2004. Phylogeny and diversification of the largest avian radiation. Proc Natl Acad Sci USA, 101:11040–11045.
Bibby CJ, Hill DA, Burgess ND, Mustoe S. 2005. Bird census techniques. Academic Press, London.
Blondel J, Catzeflis F, Perret P. 1996. Molecular phylogeny and the historical biogeography of the warblers of the genus Sylvia (Aves). J Evol Biol, 9:871–891.
Blumstein DT. 2003. Flight-initiation distance in birds is dependent on intruder starting distance. J Wildl Manage, 67:852–857.
Blumstein DT. 2006. Developing an evolutionary ecology of fear: How life history and natural history traits affect disturbance tolerance in birds. Anim Behav, 71:389–399.
Caro T. 2005. Antipredator defenses in birds and mammals. Chicago University Press, Chicago.
Cooper WE Jr. 2005. When and how does starting distance affect flight initiation distance. Can J Zool, 83:1045–1050.
Cooper WE Jr. 2008. Strong artifactual effect of starting distance on flight initiation distance in the actively foraging lizard Aspidoscelis exsanguis. Herpetol, 64:200–206.
Cooper WE, Perez-Mellado V, Vitt LJ. 2004. Ease and effectiveness of costly autotomy vary with predation intensity among lizard populations. J Zool, 262:243–255.
Cramp S, Perrins CM. 1977–1994. The birds of the Western Palearctic. Vol. 2. Oxford University Press, Oxford.
Curio E. 1976. The ethology of predation. Springer, Berlin.
Ewer RF. 1973. The carnivores. Weidenfeld and Nicholson, London.
Felsenstein J. 1985. Phylogenies and the comparative method. Am Nat, 125:1–15.
Fuller E. 2000. Extinct birds. Oxford University Press, Oxford.
Garland Jr T, Harvey PH, Ives AR. 1992. Procedures for the analysis of comparative data using phylogenetically independent contrasts. Syst Biol, 41:18–33.
Grell MB. 1998. Fuglenes Danmark. Gad, Copenhagen.
Helbig AJ, Seibold I. 1999. Molecular phylogeny of Palearctic-African Acrocephalus and Hippolais (Aves: Sylviidae). Mol Phylogenet Evol, 11:246–260.
Hochberg ME, van Baalen M. 1998. Antagonistic coevolution over productivity gradients. Am Nat, 152:620–634.
Hudson PJ. 1986. The effect of a parasitic nematode on the breeding production of red grouse. J Anim Ecol, 55:85–92.
Huhta E, Rytkönen S, Solonen T. 2003. Plumage brightness of prey increases predation risk: An among-species comparison. Ecology, 84:1793–1799.
JMP. 2000. JMP. SAS Institute Inc., Cary.
Jones KE, Purvis A. 1997. An optimum body size for mammals? Comparative evidence from bats. Funct Ecol, 11:751–756.
Lima SL. 1998. Nonlethal effects in the ecology of predator-prey interactions: What are the ecological effects of anti-predator decision-making? Bioscience, 48:25–34.
Lima SL, Dill LM. 1990. Behavioral decisions made under the risk of predation: a review and prospectus. Can J Zool, 68:619–640.
Maddison WP, Maddison DR. 2001. MacClade. Version 4.03. Sinauer, Sunderland.
Matson KD, Ricklefs RE, Klasing KC. 2005. A hemolysis-hemagglutination assay for characterizing constitutive innate humoral immunity in wild and domestic birds. Dev Comp Immunol, 29:275–286.
McNamara JM, Varta Z, Houston AI, Race P. 2005. A theoretical investigation of the effect of predators on foraging behaviour and energy reserves. Proc R Soc Lond B, 272:929–934.
Møller AP. 2008a. Flight distance and blood parasites in birds. Behav Ecol, 19:1305–1313.
Møller AP. 2008b. Flight distance of urban birds, predation and selection for urban life. Behav Ecol Sociobiol. 63:63–75.
Møller AP. 2008c. Flight distance and population trends in European breeding birds. Behav Ecol. 19:1095–1102.
Møller AP, Birkhead TR. 1994. The evolution of plumage brightness in birds is related to extra-pair paternity. Evolution, 48:1089–1100.
Møller AP, Erritzøe J. 2000. Predation against birds with low immunocompetence. Oecologia, 122:500–504.
Møller AP, Haussy C. 2007. Fitness consequences of variation in natural antibodies and complement in the barn swallow Hirundo rustica. Funct Ecol, 21:363–371.
Møller AP, Nielsen JT. 2006. Prey vulnerability in relation to sexual coloration of prey. Behav Ecol Sociobiol, 60:227–233.
Møller AP, Nielsen JT. 2007. Malaria and risk of predation: A comparative study of birds. Ecology, 8:871–881.
Møller AP, Nielsen JT, Erritzøe J. 2006a. Losing the last feather: Feather loss as an anti-predator adaptation in birds. Behav Ecol, 17:1046–1056.
Møller AP, Nielsen JT, Garamzegi LZ. 2006b. Song post exposure, song features and predation risk. Behav Ecol, 17:155–163.
Mougeot F, Bretagnolle V. 2000. Predation as a cost of sexual communication in nocturnal seabirds: an experimental approach using acoustic signals. Anim Behav, 60:647–656.
Murray DL, Cary JR, Keith LB. 1997. Interactive effects of sublethal nematodes and nutritional status on snowshoe hare vulnerability to predation. J Anim Ecol, 66:250–264.
Navarro C, Møller AP, Marzal A, de Lope F. 2004. Predation risk, host immune response and parasitism. Behav Ecol, 15:629–635.
Nielsen JT. 2004. Prey selection of sparrowhawks in Vendsyssel, Denmark. Dansk Orn Foren Tidsskr, 98:164–173 (in Danish with English summary).
Ochsenbein AF, Fehr T, Lutz C, Suter M, Brombacher F, Hengartner H, Zinklernagel RM. 1999. Control of early viral and bacterial distribution and disease by natural antibodies. Science, 286:2156–2159.
Purvis A, Rambaut A. 1995. Comparative analysis by independent contrasts (CAIC). Comp Appl Biosci, 11:247–251.
Reid RR, Prodeus AP, Kahn W, Hsu T, Rosen FS, Carroll MC. 1997. Endotoxin shock in antibody-deficient mice: unravelling the role of natural antibody and complement in clearance of lipopolysaccharide. J Immunol, 159:970–975.
Saino N, Romano M, Ferrari RP, Møller AP. 2005. Stressed mothers produce low-quality offspring with poor fitness. J Exp Zool, 303A:998–1006.
Scherrer B. 1972. Etude sur le poste de chant. Jean-le-Blanc, 11:2–46.
Sibley CG, Ahlquist JE. 1990. Phylogeny and classification of birds, a study in molecular evolution. Yale University Press, New Haven and London.
Stattersfield AJ, Capper DR. 2000. Threatened birds of the World. Lynx Ediciones, Barcelona.
Tabachnick BG, Fidell LS. 1996. Using multivariate statistics. HarperCollins, New York.
Temple SA. 1986. Do predators always capture substandard individuals disproportionately from prey populations? Ecology, 68:669–674.
Whittaker RJ. 1998. Island biogeography. Oxford University Press, Oxford.
Zuk M, Kolluru GR. 1998. Exploitation of sexual signals by predators and parasitoids. Q Rev Biol, 73:415–438.
Appendix 1.
Summary information on avian prey species, number of prey individuals, susceptibility to cat predation, susceptibility to sparrowhawk predation, susceptibility to goshawk predation, frequency of tail loss (proportion of individuals without tails), coloniality (0 – solitary, 1 – colonial), habitat (0 – open grassland, 1 – shrub, 2 – forest), mean level of natural antibodies in adults (agglutination), song post height, mean flight distance (m) and body mass (g). See Material and methods for sources.
Table
1.
Susceptibility to goshawk predation in relation to susceptibility to cat and sparrowhawk predation, body mass and body mass squared in different prey species of birds
Variable
Sum of squares
df
F
P
Slope (SE)
Species:
Cat predation
3.54
1
23.99
< 0.0001
0.59 (0.12)
Sparrowhawk predation
1.26
1
8.56
0.0078
0.56 (0.19)
Body mass
14.11
1
95.57
< 0.0001
2.86 (0.29)
Body mass squared
0.41
1
2.76
0.11
–0.81 (0.49)
Error
3.25
22
Contrasts:
Cat predation
0.32
1
9.76
0.0049
0.39 (0.13)
Sparrowhawk predation
0.30
1
9.36
0.0058
0.62 (0.20)
Body mass
1.18
1
36.14
< 0.0001
2.40 (0.40)
Body mass squared
0.01
1
0.33
0.57
0.97 (1.69)
Error
0.72
22
The two models had the statistics F = 34.89, df = 4, 22, r2 = 0.86, P < 0.0001 and F = 10.95, df = 4, 22, r2 = 0.33, P < 0.0001.

 DownLoad:


 Email Alerts
 RSS Feeds