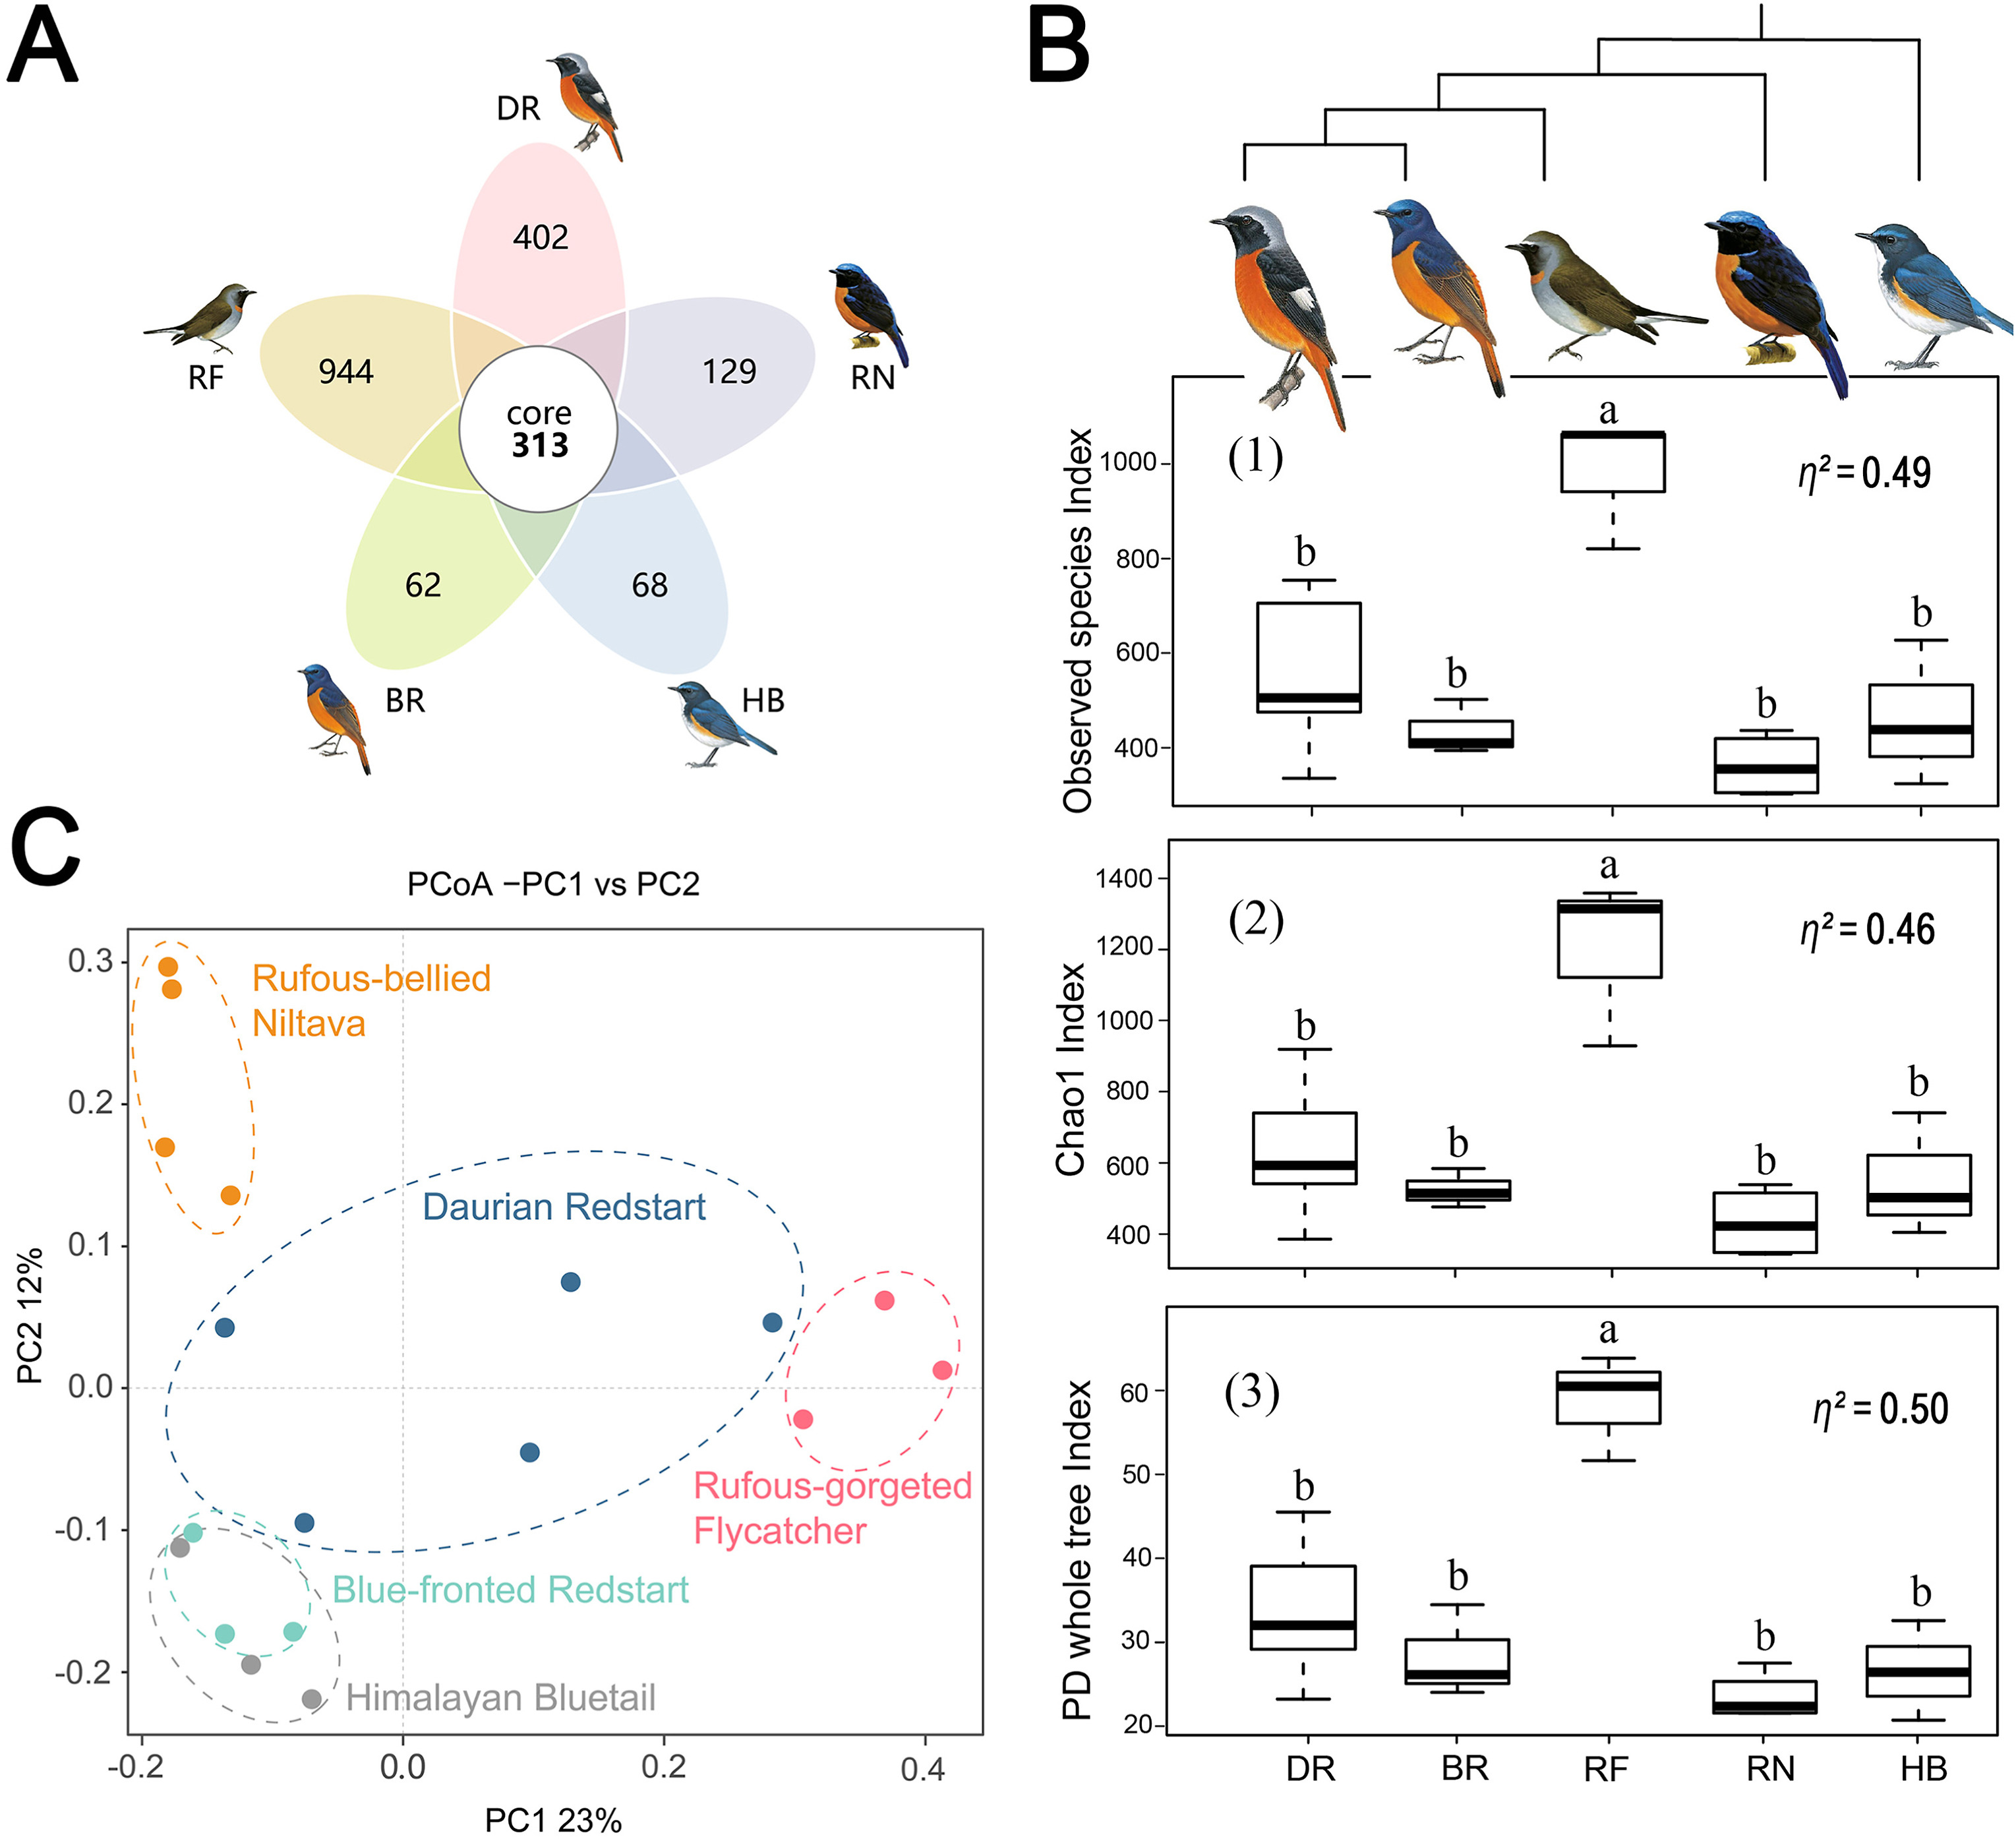
Gut microbial alpha and beta diversity in five flycatcher species. (A) Venn diagram summarizing the numbers of common and unique OTUs among five species groups. (B) Differences in microbial diversity (Chao1 index, PD whole tree and observed species index) at the OTU level between five bird species groups shown as box plots. The one with the highest alpha diversity is labeled as "a", and progressively smaller values are labeled as "b", "c", etc. The same letter means no significant difference, and different letters mean significant difference. Partial eta squared effect sizes (η2) are reported by species for each alpha diversity index. (C) Principal coordinates analysis (PCoA) on the basis of unweighted Unifrac distance of the five species of flycatchers. DR, Daurian Redstart; RF, Rufous-gorgeted Flycatcher; BR, Blue-fronted Redstart; HB, Himalayan Bluetail; RN, Rufous-bellied Niltava.
Figures of the Article
-
![]() The location of study site and biological information of five flycatchers. (A) Top, the location of mist nets; bottom, habitat photos. (B) Biological information of five flycatchers. Left, phylogenetic relationships of birds; middle, the altitudinal ranges of breeding and non-breeding seasons, red line represents breeding season, black line represents non-breeding season, and dashed line represents the elevation where the sampling site is located; right, feeding habits of birds obtained from the published database.
The location of study site and biological information of five flycatchers. (A) Top, the location of mist nets; bottom, habitat photos. (B) Biological information of five flycatchers. Left, phylogenetic relationships of birds; middle, the altitudinal ranges of breeding and non-breeding seasons, red line represents breeding season, black line represents non-breeding season, and dashed line represents the elevation where the sampling site is located; right, feeding habits of birds obtained from the published database.
-
![]() Gut microbial alpha and beta diversity in five flycatcher species. (A) Venn diagram summarizing the numbers of common and unique OTUs among five species groups. (B) Differences in microbial diversity (Chao1 index, PD whole tree and observed species index) at the OTU level between five bird species groups shown as box plots. The one with the highest alpha diversity is labeled as "a", and progressively smaller values are labeled as "b", "c", etc. The same letter means no significant difference, and different letters mean significant difference. Partial eta squared effect sizes (η2) are reported by species for each alpha diversity index. (C) Principal coordinates analysis (PCoA) on the basis of unweighted Unifrac distance of the five species of flycatchers. DR, Daurian Redstart; RF, Rufous-gorgeted Flycatcher; BR, Blue-fronted Redstart; HB, Himalayan Bluetail; RN, Rufous-bellied Niltava.
Gut microbial alpha and beta diversity in five flycatcher species. (A) Venn diagram summarizing the numbers of common and unique OTUs among five species groups. (B) Differences in microbial diversity (Chao1 index, PD whole tree and observed species index) at the OTU level between five bird species groups shown as box plots. The one with the highest alpha diversity is labeled as "a", and progressively smaller values are labeled as "b", "c", etc. The same letter means no significant difference, and different letters mean significant difference. Partial eta squared effect sizes (η2) are reported by species for each alpha diversity index. (C) Principal coordinates analysis (PCoA) on the basis of unweighted Unifrac distance of the five species of flycatchers. DR, Daurian Redstart; RF, Rufous-gorgeted Flycatcher; BR, Blue-fronted Redstart; HB, Himalayan Bluetail; RN, Rufous-bellied Niltava.
-
![]() Main composition of the gut microbiota at phyla (A) and genus (B) level in the five species.
Main composition of the gut microbiota at phyla (A) and genus (B) level in the five species.
-
![]() Differentially abundant gut microbial taxa in five species of flycatchers were identified through LEfSe analyses. (A) The cladogram depicts the phylogenic relationship between microbial taxa that were significantly different in each group. Yellow nodes represent no significant differences. (B) The LDA histogram represents the bacteria groups with significant differences among species.
Differentially abundant gut microbial taxa in five species of flycatchers were identified through LEfSe analyses. (A) The cladogram depicts the phylogenic relationship between microbial taxa that were significantly different in each group. Yellow nodes represent no significant differences. (B) The LDA histogram represents the bacteria groups with significant differences among species.
-
![]() Representative microscopic images of stomach contents of the five species of flycatchers, scale tick mark spacing is 1 mm. PAS: the percentage of stomachs containing the same fragments. RA: relative abundance of this fragment. The same color represents the same classified fragment.
Representative microscopic images of stomach contents of the five species of flycatchers, scale tick mark spacing is 1 mm. PAS: the percentage of stomachs containing the same fragments. RA: relative abundance of this fragment. The same color represents the same classified fragment.
-
![]() Heatmap showing the association of phylum-level abundance data with FCU abundance data (n = 16, phyla: Top 30 phyla in relative abundance, FCU: representative fragment classification units in the stomach of each species, the FCUs types and pictures corresponding to the numbers are shown in Fig. 5). The colors range from blue (negative correlation) to red (positive correlation). Significant correlations are marked by *p < 0.05 and **p < 0.01.
Heatmap showing the association of phylum-level abundance data with FCU abundance data (n = 16, phyla: Top 30 phyla in relative abundance, FCU: representative fragment classification units in the stomach of each species, the FCUs types and pictures corresponding to the numbers are shown in Fig. 5). The colors range from blue (negative correlation) to red (positive correlation). Significant correlations are marked by *p < 0.05 and **p < 0.01.


 Download:


 Email Alerts
 RSS Feeds