Mingju E, Tuo Wang, Shangyu Wang, Ye Gong, Jiangping Yu, Lin Wang, Wei Ou, Haitao Wang. 2019: Old nest material functions as an informative cue in making nest-site selection decisions in the European Kestrel (Falco tinnunculus). Avian Research, 10(1): 43. DOI: 10.1186/s40657-019-0182-5
Citation:
Mingju E, Tuo Wang, Shangyu Wang, Ye Gong, Jiangping Yu, Lin Wang, Wei Ou, Haitao Wang. 2019: Old nest material functions as an informative cue in making nest-site selection decisions in the European Kestrel (Falco tinnunculus). Avian Research, 10(1): 43. DOI: 10.1186/s40657-019-0182-5
Mingju E, Tuo Wang, Shangyu Wang, Ye Gong, Jiangping Yu, Lin Wang, Wei Ou, Haitao Wang. 2019: Old nest material functions as an informative cue in making nest-site selection decisions in the European Kestrel (Falco tinnunculus). Avian Research, 10(1): 43. DOI: 10.1186/s40657-019-0182-5
Citation:
Mingju E, Tuo Wang, Shangyu Wang, Ye Gong, Jiangping Yu, Lin Wang, Wei Ou, Haitao Wang. 2019: Old nest material functions as an informative cue in making nest-site selection decisions in the European Kestrel (Falco tinnunculus). Avian Research, 10(1): 43. DOI: 10.1186/s40657-019-0182-5
Jilin Engineering Laboratory for Avian Ecology and Conservation Genetics, School of Life Sciences, Northeast Normal University, Changchun 130024, China
2.
Northeast Normal University Natural History Museum, Northeast Normal University, Changchun 130024, China
3.
School of Life Sciences, Jilin University, Changchun 130012, China
4.
Ministry of Education Key Laboratory of Vegetation Ecology, School of Life Sciences, Northeast Normal University, Changchun 130024, China
5.
Key Laboratory of Wetland Ecology and Environment, Northeast Institute of Geography and Agroecology, Chinese Academy of Sciences, Changchun 130102, China
6.
Jilin Academy of Agricultural Sciences, Changchun 130033, China
7.
Jilin Provincial Key Laboratory of AnimalResource Conservation and Utilization, School of Life Sciences, Northeast Normal University, Changchun 130024, China
For secondary cavity-nesting bird species that do not add lining materials to nests, the presence of old nest material or organic remains that have accumulated within nest cavities from previous breeding events may be a cue of nest-site quality. These materials potentially contain information about past breeding success in con- and heterospecifics and may improve the thermal insulation of eggs during incubation. However, few studies have addressed whether the presence of old nest materials serves as a cue for cavity-nesting raptors when choosing specific nest sites.
Methods
We conducted a 9-year nest box experiment to test whether old nest materials from con- and heterospecifics serve as informative cues to the European Kestrel (Falco tinnunculus) when making nest selection decisions, as this species uses nest boxes without adding nesting material.
Results
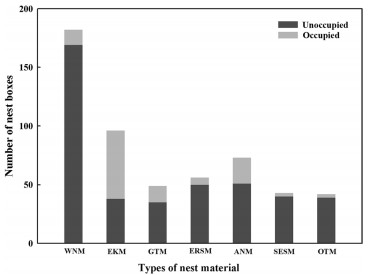
The presence of old nest materials and entrance size best discriminated nest boxes occupied by European Kestrels from unoccupied boxes. Nest boxes containing conspecific organic remains, artificial dry leaf and branch material, and material left behind by Great Tits (Parus major) were reused at higher rates, especially those containing conspecific nest material, than nest boxes containing true or simulated nest materials from predators. In 2010, no single nest box was occupied by the same banded individual that occupied the box in the previous year (10 females and 2 males were banded in 2009).
Conclusions
European Kestrels preferred nest boxes containing old nest material over empty boxes, which is consistent with previous findings that they exploit con- and heterospecific cues when deciding where to settle and breed, as old nest or organic material provides substrate for incubating females. Kestrels may be able to assess the predation risks associated with a specific nest site based on experience or the presence of prey remains. The repeated use of nest boxes across breeding seasons by kestrels cannot be entirely ascribed to philopatry. This study provides evidence that old nest materials are potentially used as informative cues when making nest-site selection decisions in European Kestrels.
Nest survival is a major component of breeding success in birds, with direct consequences on their population dynamics (Cresswell 2011). The ornithological literature often emphasizes that nest predation is the major cause of bird nest failure (Ricklefs 1969; Martin 1992). It also points out that the risk of nest predation is particularly affected by habitat parameters, through their effects on nest detectability, accessibility, and predator abundance (Martin and Roper 1988; Filliater et al. 1994; Latif et al. 2012; Guan et al. 2018). Nest predation risk is also known to vary with nesting date due to seasonal variation in predator abundance and activity (Schaub et al. 1992; Roos 2002; Cox et al. 2012; Ma et al. 2019). In addition, nest age (i.e. days after clutch initiation) is often mentioned as one of the key factors determining the risk of predation, through its possible effects on the probability that the nest is detected by predators (Schaub et al. 1992; Sockman 1997; Roos 2002). Investigating the relative importance of these factors in shaping nest survival is of great importance for assessing the breeding success of bird populations and for understanding their spatio-temporal dynamics.
Tunisian oases are semi-natural wood lots surrounded by an inhospitable desert environment, and host an original diversity of migratory and resident birds (Selmi 2000). Although the Palearctic character of this avifauna is clear (Isenmann et al. 2005), an Afro-tropical species, namely the Laughing Dove (Spilopelia senegalensis), has successfully colonized these oases and proliferated (Selmi 2000; Isenmann et al. 2005). The breeding ecology of this expanding Afro-tropical bird in the Tunisian oasis habitat has previously been described by Boukhriss and Selmi (2009) who reported a modal clutch size of two eggs (more than 95% of studied clutches) and an estimated chick productivity of one chick per breeding attempt. However, the key factors affecting nest survival have not been investigated.
The aim of this study was thus to investigate key factors affecting nest survival in a southern Tunisian population of Laughing Doves. More specifically, we assessed the relevance of nest age, laying date, nest height and vegetation structure around the nest tree as possible predictors of daily nest survival rate. Previous studies have shown that bird nest predators in the oasis habitat included snakes, Semi-domestic Cats (Felis domestica), Gennet (Genetta genetta), but the most notable impact seemed to be that of the Black Rat (Rattus rattus), which is a non-native rodent species in southern Tunisia Ruffino and Vidal (2010). This arboreal rodent is abundant in Tunisian oases and seems to more frequently prey on bird eggs than on nestlings (Selmi 2004; Boukhriss et al. 2009; Boukhriss and Selmi 2018). Because the risk of nest predation is often expected to decrease with increasing concealment and decreasing accessibility (Colombelli-Négrel and Kleindorfer 2009), daily nest survival rate was hypothesized to increase with increasing vegetation density around the nest tree, and also with increasing nest height. In addition, since parental activity around the nest is generally assumed to be higher during the chick rearing phase than during egg incubation (Skutch 1949; Roper and Goldstein 1997; Martin et al. 2000), the risk of the nest being detected and attacked by predators was expected to increase as the nesting attempt progressed. A negative relationship between age and nest survival was therefore expected. Nest survival rate could also be expected to vary across the breeding season, mainly because of possible seasonal changes in nesting microhabitat, and hence nest concealment (Winter et al. 2005; Ludwig et al. 2012), and in the activity of nest predators (Sperry et al. 2008; Husby and Hoset 2018).
Methods
Study area and field procedure
This work was carried out in the oasis of Kettana, in the south-east of Tunisia (33° 45ʹ N, 10° 13ʹ E). This palm grove covers an area of 464 ha and is composed of a mosaic of small private fields where farmers practice a rural agricultural activity based on irrigation and crop diversification. Within this oasis the plant cover is organized into three main layers: herbaceous plants (cultivated and spontaneous), fruit trees, mainly olive trees (Olea europaea) and pomegranate trees (Punica granatum), and date palm trees (Phoenix dactylifera).
From early March to mid-August 2005, nests were searched for by checking potential nest sites available in the area, while paying attention to the behaviour of the birds that can sometimes inform about the location of the nest. When an active nest was found, we immediately checked its content and tried to determine nest age and laying date. Nest age was precisely recorded for nests whose laying date was known, i.e. nests discovered before the laying of the first egg. However, for nests discovered during the incubation or chick rearing stages, nest age at the moment of discovery could not be determined with precision. We thus relied on the aspect of eggs or chicks and we used descriptive accounts from known-aged nests in the same population to determine approximately nest age and laying date. Then the nest was marked by placing one coloured plastic band at 1 m from the nest tree and was regularly checked until failure or fledging. Nests were monitored every 5 days during incubation and daily after eggs hatched until the end of the breeding attempt. To avoid disturbance, nests were usually observed from a distance to ensure that they were empty before approaching them. Nests were considered successful if at least one young fledged. Following Manolis et al. (2000), nest exposure was determined as the number of days since nest discovery until the halfway point between the last day that the nest was known to be active and the day that the breeding attempt was observed to have finished (fledging or loss).
After the nest was inactive (i.e. fledging or failure), we measured nest height (m), and we assessed visually the covers (%) of palm trees, fruit trees and herbaceous plants in a 5 m-radius circle. These vegetation variables provided descriptors of habitat structure in the close nest tree environment. We are aware that the possible change in foliage density between the day of nest discovery and the end of the nesting attempt may have introduced some bias in our data, but we did so to avoid disturbing birds and attracting predators to the nest. All measurements were usually conducted by the same observer (J. Boukhriss) to avoid a possible observer effect.
Data analyses
We first conducted a principal component analysis (PCA) on the three assessed vegetation variables (covers of palm trees, fruit trees and herbaceous plants) to summarize them into a composite index of vegetation structure at the close nest environment. This PCA was conducted using the FACTOR procedure in SAS software (1998).
Nest monitoring data were first used to estimate daily nest survival rate using the Mayfield method, which accounts for heterogeneity in exposure period among nests (Mayfield 1975). The rate of nesting success was then estimated by raising the obtained estimate to the power of the number of days of nesting (Mayfield 1975), which is habitually 28 days in the studied Laughing Dove population (14 days of egg incubation and 14 days of nestling rearing; personal data).
We also investigated the relevance of nest height, vegetation structure in the close nest tree environment (i.e. a 5 m-radius circle around the nest tree), nest age (days after clutch initiation) and laying date (Julian date of the first egg laying) as predictors of nest daily survival rate, by using the modelling approach of Shaffer (2004). We used the GENMOD procedure in SAS (1998) to fit logistic exposure models with a binomial error distribution and a logit-link function. We constructed 16 candidate models, including a constant model (i.e., without covariates) and models considering each of the four covariates by itself or in association with one, two or three other covariates. The candidate models were then ranked according to their AICc scores (Akaike's Information Criterion corrected for small sample size), with lowest AICc indicating the best approximating model for the data (Burnham and Anderson 2002). Models with ΔAICc > 4 were considered to have little to no empirical support (Burnham and Anderson 2002). We also took into account model selection uncertainty by using the model-averaging technique (Burnham and Anderson 2002) for the assessment of the effects of covariates on daily nest survival rate. The relative importance of each variable was obtained by summing up the weights (W) of all models including that variable (Burnham and Anderson 2002), and its averaged effect (and associated 95% confidence interval) was estimated following the formula: βaverage = ΣWiβi, where Wi is the weight of model i and βi is the estimated effect of the considered covariate according to model i (Burnham and Anderson 2002). The effect of a given covariate on daily nest survival rate was considered as significant at the 5% level if the 95% confidence interval of its βaverage did not overlap zero.
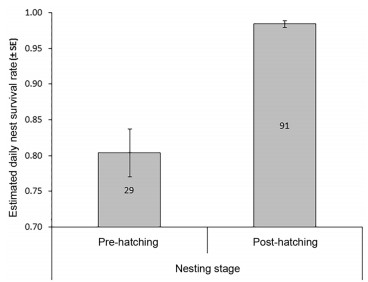
Finally, as we were interested in exploring more the relationship between nest age and daily survival rate, we sought to investigate how daily nest survival rate varied between the pre-hatching (incubation) and post-hatching (chick rearing) stages. To do so, we subdivided our nest sample into two sub-samples: (1) nests discovered during the pre-hatching stage and (2) nests discovered during the post-hatching stage. For the pre-hatching sub-sample, the clutches that succeeded to hatch eggs were considered successful, while the success corresponded to the fledging of chicks for the post-hatching sub-sample. In other words, we estimated the rate of clutch hatching and the rate of chick fledging in hatched clutches. The estimations were conducted using the Mayfield method (1975), and the comparison between the obtained estimates was conducted by means of a z-test following the procedure described in Johnson and Shaffer (1990).
Results
In total, 120 Laughing Dove nests were found and monitored. The exposure period varied among nests, from 2 to 35 days, with an average (± SE) of 13 ± 2 days. The earliest egg laying occurred on March 16, while the latest one was on August 8. The age of the nest at its discovery varied between 4 and 28 days, with an average (± SE) of 22 ± 0.78 days.
Most nests were placed on pomegranate trees (55%) and olive trees (40%). The remaining 5% of nests were placed on four species of fruit trees (apricot, pear, mulberry and grape). Nest height ranged from 0.80 to 5.98 m, with an average (± SE) of 2.59 ± 0.09 m. With regard to vegetation structure around the nest tree, the PCA conducted on the three assessed vegetation variables (covers of palm trees, fruit trees and herbaceous plants) summarized them into one factor (first component) providing a composite index of vegetation structure at the close nest environment. This factor had an eigenvalue of 1.41 and accounted for 47% of the variance in the original data, while the second component derived from the PCA had an eigenvalue less than 1 (0.90) and was not retained. The index of vegetation structure derived from the PCA was positively correlated with the covers of palm trees (r = 0.58, p < 0.0001) and herbaceous plants (r = 0.69, p < 0.0001) and negatively correlated with the cover of fruit trees (r = - 0.78, p < 0.0001). Low scores characterized dense plantations of fruit trees where palm trees and herbaceous plants were rare. However, high scores characterized plots where fruit trees were replaced by palm trees, giving a more open appearance and allowing the development of an important herbaceous cover.
Among the 120 nests monitored, 40 were depredated, while 80 were successful to raise at least one fledgling. This gave an apparent nest success rate (i.e., proportion of successful nests) of 67% (95% CI 58-75%). However, when the heterogeneity in exposure period among monitored nests was accounted for, by applying the Mayfield method, the daily nest survival rate was estimated at 0.975 (95% CI 0.968-0.983), corresponding to an estimated rate of nesting success of 49% (95% CI 40-62%).
Results of logistic exposure regressions showed that among the 16 competing models, four models were supported by the data and provided parsimonious models in explaining variation in daily survival rates among the studied nests (Table 1). Together, these highly-ranked models summed up a weight exceeding 99%, while the remaining models had negligible weights and could not be considered.
Table
1.
Results of model selection for daily nest survival rate as a function of nest age, nesting date, nest height and vegetation structure in the close nest environment
Rank
Model
K
AICc
ΔAICc
W
1
Vegetation + Age
3
160.271
0.000
0.39678
2
Vegetation + Age + Height
4
160.673
0.402
0.32452
3
Vegetation + Age + Date
4
162.186
1.915
0.15232
4
Vegetation + Age + Height + Date
5
162.576
2.305
0.12533
5
Vegetation
2
173.927
13.656
0.00043
6
Vegetation + Date
3
174.477
14.206
0.00033
7
Vegetation + Height
3
175.822
15.551
0.00017
8
Vegetation + Date + Height
4
176.323
16.052
0.00012
9
Age + Date
3
195.941
35.670
0.00000
10
Age + Date + Height
4
197.337
37.065
0.00000
11
Age
2
200.513
40.242
0.00000
12
Age + Height
3
201.691
41.420
0.00000
13
Constant model (intercept only)
1
318.373
158.101
0.00000
14
Date
2
320.306
160.035
0.00000
15
Height
2
320.373
160.102
0.00000
16
Date + Height
3
322.304
162.032
0.00000
Models that received the highest support by the data are highlighted in italics. K = number of parameters, AICc = Akaike's Information Criterion corrected for small sample size, ΔAICc = Difference in AICc from the top ranked model, W = model weight
All four selected models included the effects of vegetation structure around the nest tree and nest age (Table 1), suggesting that these two parameters were the best predictors of daily nest survival rate in our studied population. Moreover, these two parameters showed weights exceeding 99%, and were the only investigated variables to have estimated effects whose confidence intervals did not include zero (Table 2). Nest daily survival rate was negatively related to the index of vegetation structure (Table 2; Fig. 1), indicating that the presence of palm trees in the close nest tree environment (i.e. high score of vegetation structure index) was associated with reduced chance of nesting success and increased risk of predation. It was however positively related to nest age (Table 2), suggesting that the risk of nest failure decreased as the nesting attempt progressed, throughout the egg incubation and nestling stages. The latter suggestion was also supported by the comparison of the estimated daily survival rates of nests in the two breeding stages (Fig. 2; z = 5.376, p < 0.0001).
Table
2.
Model-averaged parameter estimates and associated 95% confidence intervals derived from the 16 candidate logistic-exposure models for daily nest survival rate as a function of nest age, laying date, nest height and vegetation structure in the close nest environment
Parameter
βaverage
95% confidence interval
Lower
Upper
Intercept
1.553
0.067
3.040
Age
0.121
0.065
0.177
Date
0.001
– 0.004
0.005
Height
– 0.132
– 0.527
0.262
Vegetation
– 1.246
– 1.674
– 0.817
Significant effects at the 5% level are highlighted in italics
Figure
1.
Plot of predicted daily nest survival rate as a function of vegetation structure in the close nest tree environment. Dashed lines represent the limits of 95% confidence interval for the estimated daily nest survival rates
Figure
2.
Comparison of the estimated daily nest survival rates between the pre-hatching (egg incubation) and post-hatching (chick rearing) stages. Numbers on the bars indicate sample sizes
In this study we investigated factors shaping the survival of Laughing Dove nests in a southern Tunisian oasis habitat. By doing so, we mainly aimed to provide information helping to understand the breeding success and the expansion of this afro-tropical bird species in a North African area. Our results showed that the estimated daily survival rate of Laughing Dove nests in the studied oasis was similar to those previously estimated for some Palearctic passerine species nesting in the same oasis habitat, i.e. the Rufous Bush Robin (0.970) and Woodschat Shrike (0.980) (Boukhriss and Selmi 2018). It was also equal to that reported for the same dove species by Brahmia et al. (2015) in an agricultural landscape in northern Algeria (0.975). We also found that vegetation structure in the close nest tree environment and nest age provided important predictors of daily nest survival rate in the studied Laughing Dove population, whereas neither nest height nor laying date showed significant effects.
Our results showed that the presence of palm trees near the nest tree was associated with decreased daily nest survival rate. Dense plantations of fruit trees offered safer nesting sites compared to plots with a mixture of fruit trees and palm trees. This result could be explained by increased abundance and/or activity of nest predators around palm trees compared to fruit tree plantations. Palm trees seemed to provide refuges for small nest predators, increasing the probability of the nests to be detected and depredated. Indeed, with their multiple suckers, palm trees often form dense tufts serving as refuges for wild mammals, notably the Black Rat which seemed to be the main nest predator in the oasis habitat (Selmi 2004; Boukhriss et al. 2009; Boukhriss and Selmi 2018). Overall, this explanation is consistent with the general trend of decreased bird nest survival in preferred habitats for nest predators (Johnson and Temple 1990; Dion et al. 2000; Whittingham and Evans 2004; Hammond 2016). Moreover, given the arboreal habits of this rodent and the low height at which dove nests were built, the lack of relationship between nest survival and height is no longer surprising.
With regard to nest age, our results showed that daily nest survival rate increased as the nesting attempt progressed, a pattern that has also been reported in passerines breeding in the same habitat (Boukhriss and Selmi 2018) and in other different habitats (e.g., Martin 1992; Roper and Goldstein 1997). Nest survival was higher during the nestling period compared to the egg incubation period, which is contrary to the widespread opinion of increased nest mortality during the post-hatching period (Skutch 1949; Roper and Goldstein 1997; Martin et al. 2000).
Several non-exclusive hypotheses could be proposed to explain the positive relationship of daily nest survival with nest age. First, the Black Rat seemed to more frequently consume bird eggs than nestlings in the oasis habitat (Boukhriss et al. 2009; Boukhriss and Selmi 2018). Its impact on bird nests would thus be higher during egg incubation compared to the nestling stage. An alternative explanation could be the possible increase in parental defence behaviour with the progress in the nesting attempt. Indeed, birds are known to take higher risk against predators and to defend more intensely their nests as the breeding attempt progresses and its reproductive value increases (Montgomerie and Weatherhead 1988; Brunton 1990; Boukhriss and Selmi 2010). We thus hypothesise that the observed increase in daily nest survival rate with nest age could be at least partly due to the increase in the intensity of nest defence behaviour exhibited by parents with the progress in the nesting attempt. Lastly, the positive relationship between nest age and nest survival rate may be a simple artifact. Indeed, nests easily detectable by predators (i.e. less concealed and more accessible nests) are more likely to be eliminated early (i.e. during egg laying or early incubation), resulting in a low estimate of the daily nest survival rate. On the other hand, nests arriving at an advanced stage would be nests that had escaped predation because they had a low probability of being detected. The last nests would necessarily have a high probability of survival.
Conclusions
In conclusion, our results suggested that the presence of palm trees in the close environment of the nest tree was associated with increased predation risk. Clumps of palm tree suckers seemed to provide refuges for small nest predators, notably the Black Rat, which has been reported to be the main nest predator in the oasis habitat. The predatory activity of this rodent seemed more directed against eggs than nestlings, which may explain the observed increase in daily survival rate with nest age. Investigations of the ecology and feeding behavior of this nest predator in the oasis habitat are however needed for firmer conclusions about these issues.
Acknowledgements
We thank H. Belwafi and A. Belwafi who helped a lot in nest finding.
Authors' contributions
JB and SS conceived and designed the study. JB performed the field work. JB and SS processed and analyzed the data. JB wrote the manuscript. SS made comments to the manuscript. Both authors read and approved the final manuscript.
Availability of data and materials
The datasets used in the present study are available from the corresponding author on reasonable request.
Ethics approval and consent to participate
This work complies with the current laws of Tunisia. It was based on simple field observation without any experimental manipulation or prejudice to the studied birds.
Consent for publication
Not applicable.
Competing interests
The authors declare that they have no competing interests.
Aitken KEH, Wiebe KL, Martin K. Nest-site reuse patterns for a cavity-nesting bird community in interior British Columbia. Auk. 2002;119:391-402.
Aparicio JM, Bonal R, Munoz A. Experimental test on public information use in the colonial Lesser Kestrel. Evol Ecol. 2007;21:783-800.
Beheler AS, Rhodes OE, Weeks PH. Breeding site and mate fidelity in Eastern Phoebes (Sayornis phoebe) in Indiana. Auk. 2003;120:990-9.
Beletsky LD, Orians GH. Effects of breeding experience and familiarity on site fidelity in female red-winged blackbirds. Ecology. 1991;72:787-96.
Bouslama Z, Lambrechts MM, Ziane N, Djenidi R, Chabi Y. The effect of nest ectoparasites on parental provisioning in a north-African population of the Blue Tit Parus caeruleus. Ibis. 2002;144:e73-8.
Brown CR, Brown MB. Coloniality in the Cliff Swallow: the effect of group size on social behavior. J Parasitol. 1997;27:751.
Burnham KK, Burnham WA, Newton I. Gyrfalcon Falco rusticolus post-glacial colonization and extreme long-term use of nest-sites in Greenland. Ibis. 2009;151:514-22.
Citta JJ, Lindberg MS. Nest-site selection of passerines: effects of geographic scale and public and personal information. Ecology. 2007;88:2034-46.
Dall SRX, Giraldeau LA, Olsson O, McNamara JM, Stephens DW. Information and its use by animals in evolutionary ecology. Trends Ecol Evol. 2005;20:187-93.
Danchin E, Boulinier T, Massot M. Conspecific reproductive success and breeding habitat selection: implications for the study of coloniality. Ecology. 1998;79:2415-28.
Davies WH, Kalisz PJ, Wells RJ. Eastern bluebirds prefer boxes containing old nests. J Field Ornithol. 1994;65:250-3.
Deng QX, Wang HT, Yao D, Wang XY, E MJ, Wang T, et al. Conspecific brood parasitism and nesting biology of Mandarin ducks Aix galericulata in northeast China. Wilson J Ornithol. 2011;123:479-85.
Dow H, Fredga S. Breeding and natal dispersal of the goldeneye, Bucephala clangula. J Anim Ecol. 1983;52:681-96.
Dubois F, Cezilly F, Pagel M. Mate fidelity and coloniality in waterbirds: a comparative analysis. Oecologia. 1998;116:433-40.
Erckmann WJ, Beletsky LD, Orians GH, Johnsen T, Sharbaugh S, Antonio C. Old nests as cues for nest-site selection: an experimental test with Red-winged Blackbirds. Condor. 1990;92:113-7.
Forsman JT, Hjernquist MB, Taipale J, Gustafsson L. Competitor density cues for habitat quality facilitating habitat selection and investment decisions. Behav Ecol. 2008;19:539-45.
Frey SJK, Hadley AS, Betts MG. Microclimate predicts within-season distribution dynamics of montane forest birds. Divers Distrib. 2016;22:944-59.
Galef BG, Giraldeau L. Social influences on foraging in vertebrates: causal mechanisms and adaptive functions. Anim Behav. 2001;61:3-15.
Geng R, Zhang X, Ou W, Sun HM, Lei FM, Gao W, et al. Diet and prey consumption of breeding Common Kestrel (Falco tinnunculus) in Northeast China. Prog Nat Sci. 2009;19:1501-7.
Gibb BJ. The breeding biology of the great and blue titmice. Ibis. 1950;92:507-39.
Gong Y, Bibi N, Wang HT. Nest usurpation between Mandarin Duck Aix galericulata and coexisting bird species in nest boxes in a secondary forest, Zuojia Nature Reserve, China. Pak J Zool. 2018;50:1537.
Gowaty PA, Plissner JH. Breeding dispersal of eastern bluebirds depends on nesting success but not on removal of old nests: an experimental study. J Field Ornithol. 1997;68:323-30.
Hilton GM, Hansell MH, Ruxton GD, Reid JM, Monaghan P. Using artificial nests to test importance of nesting material and nest shelter for incubation energetics. Auk. 2004;121:777-87.
Hromada M, Antczak M, Valone TJ, Tryjanowski P. Settling decisions and heterospecific social information use in shrikes. PLoS ONE. 2008;3:e3930.
Johannesen E, Perriman L, Steen H. The effect of breeding success on nest and colony fidelity in the Little Penguin (Eudyptula minor) in Otago, New Zealand. Emu. 2002;102:241-7.
Johnson LS. Removal of old nest material from the nesting sites of house wrens: effects on nest site attractiveness and ectoparasite loads. J Field Ornithol. 1996;67:212-21.
Lagrange P, Gimenez O, Doligez B, Pradel R, Garant D, Pelletier F, et al. Assessment of individual and conspecific reproductive success as determinants of breeding dispersal of female tree swallows: a capture-recapture approach. Ecol Evol. 2017;7:7334-46.
Lindberg MS, Sedinger JS. Ecological consequences of nest site fidelity in Black Brant. Condor. 1997;99:25-38.
López BC, Potrony D, López A, Badosa E, Bonada A, Salo R. Nest box use by boreal owls (Aegolius funereus) in the Pyrenees mountains in Spain. J Raptor Res. 2010;44:40-9.
Mainwaring MC, Hartley IR, Lambrechts MM, Deeming DC. The design and function of birds' nest. Ecol Evol. 2014;4:3909-28.
Martin TE. Processes organizing open-nesting bird assemblages: competition or nest predation? Evol Ecol. 1988;2:37-50.
Marzluff JM. Do pinyon jays alter nest placement based on prior experience? Anim Behav. 1988;36:1-10.
Mazgajski TD. Nest site choice in relation to the presence of old nests and cavity depth in the starling Sturnus vulgaris. Ethol Ecol Evol. 2003;15:273-81.
Mazgajski TD. Effect of old nest material on nest site selection and breeding parameters in secondary hole nesters—a review. Acta Ornithol. 2007;42:1-14.
Negro JJ, Hiraldo F. Nest-site selection and breeding success in the lesser kestrel Falco naumanni. Bird Study. 1993;40:115-9.
Nilsson SG, Johnsson K, Tjernberg M. Is avoidance by black woodpeckers of old nest holes due to predators? Anim Behav. 1991;8:439-41.
Olsson K, Allander K. Do fleas and/or old nest material, influence nest site preference in hole-nesting passerines? Ethology. 1995;101:160-70.
Ondrušová K, Adamík P. Characterizing the mammalian hair present in great tit (Parus major) nests. Bird Study. 2013;60:428-31.
Orell M, Rytkönen S, Ilomäki K. Do pied flycatchers prefer nest boxes with old nest material? Ann Zool Fenn. 1993;30:313-6.
Orians GH, Wittenberger JF. Spatial and temporal scales in habitat selection. Am Nat. 1991;137:S29-49.
Parejo D, Danchin E, Silva N, White JF, Dreiss AN, Avilés JM. Do great tits rely on inadvertent social information from blue tits? A habitat selection experiment. Behav Ecol Sociobiol. 2008;62:1569-79.
Pärt T, Doligez B. Gathering public information for habitat selection: prospecting birds cue on parental activity. Proc R Soc Lond B Biol Sci. 2003;270:1809-13.
Podofillini S, Cecere JG, Griggio M, Curcio A, De Capua EL, Fulco E, et al. Home, dirty home: effect of old nest material on nest-site selection and breeding performance in a cavity-nesting raptor. Curr Zool. 2018;64:693-702.
Proctor H, Owens I. Mites and birds: diversity, parasitism and coevolution. Trends Ecol Evol. 2000;15:358-64.
Pyle P, Sydeman WJ, Hester M. Effects of age, breeding experience, mate fidelity and site fidelity on breeding performance in a declining population of Cassin's auklets. J Anim Ecol. 2001;70:1088-97.
Reitsma LA, Holmes RT, Sherly TW. Effects of removal of red squirrels, Tamiasciurus hudsonicus, and eastern chipmunks, Tamias striatus, on nest predation in a northern hardwood forest: an artificial nest experiment. Oikos. 1990;57:375-80.
Rendell WB, Verbeek NA. Old nest material in nest boxes of tree swallows: effects on nest-site choice and nest building. Auk. 1996;113:319-28.
Ruth JM, Skagen SK. Territory and nest site selection patterns by Grasshopper Sparrows in southeastern Arizona. Condor. 2017;119:469-83.
Saino N, Calza S, Møller AP. Effects of a dipteran ectoparasite on immune response and growth trade-offs in Barn Swallow, Hirundo rustica, nestlings. Oikos. 1998;81:217-28.
Serrano D, Tella JL, Forero MG, Donázar JA. Factors affecting breeding dispersal in the facultatively colonial lesser kestrel: individual experience vs conspecific cues. J Anim Ecol. 2001;70:568-78.
Serrano D, Tella JL, Donázar JA, Pomarol M. Social and individual features affecting natal dispersal in the colonial lesser kestrel. Ecology. 2003;84:3044-54.
Sorace A, Petrassi F, Consiglio C. Long-distance relocation of nestboxes reduces nest predation by Pine Marten Martes martes. Bird Study. 2004;51:119-24.
Stanback MT, Dervan AA. Within-season nestsite fidelity in Eastern Bluebirds: disentangling effects of nest success and parasite avoidance. Auk. 2001;118:743-5.
Stanback MT, Rockwell EK. Nest-site fidelity in Eastern Bluebirds (Sialia sialis) depends on the quality of alternate cavities. Auk. 2003;120:1029-32.
Styrsky JN. Influence of predation on nest-site reuse by an open-cup nesting neotropical passerine. Condor. 2005;107:133-7.
Sumasgutner P, Vasko V, Varjonen R, Korpimaki E. Public information revealed by pellets in nest sites is more important than ectoparasite avoidance in the settlement decisions of Eurasian Kestrels. Behav Ecol Sociobiol. 2014;68:2023-34.
Switzer PV. Site fidelity in predictable and unpredictable habitats. Evol Ecol. 1993;7:533-55.
Tomás G, Merino S, Moreno J, Morales J. Consequences of nest reuse for parasite burden and female health and condition in blue tit, Cyanistes caeruleus. Anim Behav. 2007;73:805-14.
Vergara P, Aguirre JI, Fargallo JA, Davila JA. Nest-site fidelity and breeding success in White Stork Ciconia ciconia. Ibis. 2006;148:672-7.
Wesolowski T. Anti-predator adaptations in nesting marsh tits Parus palustris: the role of nest-site security. Ibis. 2002;144:593-601.
Wiens JA. Population responses to patchy environment. Annu Rev Ecol Syst. 1976;7:81-120.
Zhou T, Wang HT, Liu Y, Lei FM, Gao W. Patterns of magpie nest utilization by a nesting raptor community in a secondary forest. Prog Nat Sci. 2009;19:1253-9.
Banisaffar, M., Shabani, A.A. Factors influencing nest site selection of the Laughing Dove (Spilopelia senegalensis) in an urban area in Karaj, Iran. Ornis Hungarica, 2024, 32(2): 117-137.
DOI:10.2478/orhu-2024-0026
2.
Yapıcı, N., Erdoğan, A. The expansive Laughing Dove (Spilopelia senegalensis), an all-year breeder in southern Turkey. Zoology in the Middle East, 2023, 69(1): 1-5.
DOI:10.1080/09397140.2023.2172861
3.
Tian, L., Liu, Y., Zhou, Z. et al. Reproductive Success of a Tropical Barn Swallow Hirundo rustica Population Is Lower Than That in Temperate Regions. Animals, 2023, 13(1): 62.
DOI:10.3390/ani13010062
4.
Hamza, F., Kahli, A., Almalki, M. et al. Distance from industrial complex, urban area cover, and habitat structure combine to predict richness of breeding birds in southeastern Tunisian oases. Environmental Science and Pollution Research, 2022, 29(22): 33191-33204.
DOI:10.1007/s11356-021-18051-8
5.
Hamza, F., Hanane, S. The effect of microhabitat features, anthropogenic pressure and spatial structure on bird diversity in southern Tunisian agroecosystems. Annals of Applied Biology, 2021, 179(2): 195-206.
DOI:10.1111/aab.12690
6.
Weiser, E.L.. Fully accounting for nest age reduces bias when quantifying nest survival. Ornithological Applications, 2021, 123(3)
DOI:10.1093/ornithapp/duab030
7.
Perrella, D.F., Zima, P.V.Q., Francisco, M.R. Nest Site Selection along Forest-Streams by Two Forest-Dwelling Neotropical Passerines. Acta Ornithologica, 2020, 55(2): 187-198.
DOI:10.3161/00016454AO2020.55.2.005
8.
Saâd, N., Hanane, S., Farhi, K. et al. Nest Age as Predictor of Nest Survival in Three Sympatric Dove Species Breeding in a Mediterranean Arid Agroecosystem. Ardea, 2020, 108(2): 171-182.
DOI:10.5253/arde.v108i2.a5
Jilin Engineering Laboratory for Avian Ecology and Conservation Genetics, School of Life Sciences, Northeast Normal University, Changchun 130024, China
7.
Jilin Provincial Key Laboratory of AnimalResource Conservation and Utilization, School of Life Sciences, Northeast Normal University, Changchun 130024, China
Table
1.
Results of model selection for daily nest survival rate as a function of nest age, nesting date, nest height and vegetation structure in the close nest environment
Rank
Model
K
AICc
ΔAICc
W
1
Vegetation + Age
3
160.271
0.000
0.39678
2
Vegetation + Age + Height
4
160.673
0.402
0.32452
3
Vegetation + Age + Date
4
162.186
1.915
0.15232
4
Vegetation + Age + Height + Date
5
162.576
2.305
0.12533
5
Vegetation
2
173.927
13.656
0.00043
6
Vegetation + Date
3
174.477
14.206
0.00033
7
Vegetation + Height
3
175.822
15.551
0.00017
8
Vegetation + Date + Height
4
176.323
16.052
0.00012
9
Age + Date
3
195.941
35.670
0.00000
10
Age + Date + Height
4
197.337
37.065
0.00000
11
Age
2
200.513
40.242
0.00000
12
Age + Height
3
201.691
41.420
0.00000
13
Constant model (intercept only)
1
318.373
158.101
0.00000
14
Date
2
320.306
160.035
0.00000
15
Height
2
320.373
160.102
0.00000
16
Date + Height
3
322.304
162.032
0.00000
Models that received the highest support by the data are highlighted in italics. K = number of parameters, AICc = Akaike's Information Criterion corrected for small sample size, ΔAICc = Difference in AICc from the top ranked model, W = model weight
Table
2.
Model-averaged parameter estimates and associated 95% confidence intervals derived from the 16 candidate logistic-exposure models for daily nest survival rate as a function of nest age, laying date, nest height and vegetation structure in the close nest environment
Parameter
βaverage
95% confidence interval
Lower
Upper
Intercept
1.553
0.067
3.040
Age
0.121
0.065
0.177
Date
0.001
– 0.004
0.005
Height
– 0.132
– 0.527
0.262
Vegetation
– 1.246
– 1.674
– 0.817
Significant effects at the 5% level are highlighted in italics

 DownLoad:


 Email Alerts
 RSS Feeds