Ruben C. Fijn, Wouter Courtens, Bas W.R. Engels, Emiel E. van Loon, Judy Shamoun-Baranes. 2024: Combining video and GPS-tracking to study the spatial foraging distribution of a single-prey loading seabird. Avian Research, 15(1): 100196. DOI: 10.1016/j.avrs.2024.100196
Citation:
Ruben C. Fijn, Wouter Courtens, Bas W.R. Engels, Emiel E. van Loon, Judy Shamoun-Baranes. 2024: Combining video and GPS-tracking to study the spatial foraging distribution of a single-prey loading seabird. Avian Research, 15(1): 100196. DOI: 10.1016/j.avrs.2024.100196
Ruben C. Fijn, Wouter Courtens, Bas W.R. Engels, Emiel E. van Loon, Judy Shamoun-Baranes. 2024: Combining video and GPS-tracking to study the spatial foraging distribution of a single-prey loading seabird. Avian Research, 15(1): 100196. DOI: 10.1016/j.avrs.2024.100196
Citation:
Ruben C. Fijn, Wouter Courtens, Bas W.R. Engels, Emiel E. van Loon, Judy Shamoun-Baranes. 2024: Combining video and GPS-tracking to study the spatial foraging distribution of a single-prey loading seabird. Avian Research, 15(1): 100196. DOI: 10.1016/j.avrs.2024.100196
Waardenburg Ecology, Department of Bird Ecology, Culemborg, the Netherlands
b.
University of Amsterdam, Institute for Biodiversity and Ecosystem Dynamics, Amsterdam, the Netherlands
c.
Research Institute for Nature and Forest (INBO), Brussels, Belgium
Funds:
GPS-tracking of Sandwich Terns was part of the monitoring programme into the effects of the compensation measures designed for the construction of the seaward expansion of the Rotterdam Harbour (‘Tweede Maasvlakte’). This programme (PMR-NCV) was initiated by the Dutch Ministry of Infrastructure and the Environment and commissioned by Rijkswaterstaat WVL (M. van Eerden, K. Borst). Bureau Waardenburg (BW), the Research Institute for Nature and Forest (INBO), and Deltamilieu Projecten (DMP) carried out the research on terns within a project commissioned by Wageningen Marine Research (a.o. I. Tulp) and Deltares (a.o. T. Prins). Tracking of Sandwich Terns was performed under project licence for animal procedures AVD401002015102 of the Central Authority for Scientific Procedures on Animals. Camera monitoring was part of a research grant to DMP and BW by Vogelbescherming Nederland. Project manager was F. Arts (DMP) and he is greatly thanked for his input. Fieldwork in both projects was carried in a nature reserve of Natuurmonumenten and W. van Steenis, H. Meerman, J. de Roon and M. Broere are specifically acknowledged for their cooperation and hospitality. The authors would like to thank T. Boudewijn, J. de Jong, E. Bravo Rebolledo, A. Gyimesi, M. Poot (BW), E. Stienen, H. Verstraete, M. Van der walle and N. Vanermen (INBO) for help in the field. The INBO team is specifically thanked for their observations of prey items. R. Middelveld (BW) is thanked for providing the map with foraging locations. The comments of two anonymous referees and Giacomo Dell'Omo greatly improved this manuscript
Seabirds are valuable indicators of marine ecosystem processes and studying seabird diets can shed light on natural or human-induced variability in food-web composition. Specifically single-prey loading seabird species such as terns have the potential to act as visual sentinels of prey availability offshore. However, obtaining diet information from remote bird colonies is often challenging and time consuming. In this pilot study we present a novel approach to combine two established methods to study seabird foraging ecology, providing a powerful and cost-effective tool to study the distribution of prey items available to seabirds. We combined GPS tracking data of Sandwich Terns (Thalasseus sandvicensis) with prey-observations from a hide in 2012 and 2013, and from semi-continuously recorded camera footage in 2017. By doing so, we identified 115 approximate catch locations of prey (86 herring/sprat Clupeidae, 29 sandeel Ammodytidae). Combining GPS-data and prey observations yielded detailed knowledge on the movements and chick diets of tracked birds as well as the spatial origin and lengths of captured prey items. Further catch distances of both Clupeidae and Ammodytidae resulted in deliveries of larger prey items and thus higher energy yield per trip, but also a higher energy expenditure per trip. We discuss the limitations and potential of our methodological approach to study foraging energetics during chick-provisioning of seabirds that carry prey items visible in their beaks.
Seabirds are often regarded as indicators of the health of the marine ecosystem and changes in their breeding or feeding patterns might signal changes in marine productivity or environmental pollution (Furness and Camphuysen, 1997; van Franeker, 2001; Parsons et al., 2008). Therefore, many detailed studies on seabird diets have been published as changes in diets may shed light on natural or human-induced variability in food-web composition (Montevecchi and Myers, 1996; Bicknell et al., 2013). Furthermore, studying diets enables the estimation of seabird energy budgets and consequences for life history parameters (Ellis and Gabrielsen, 2002; Fort et al., 2011; Buckingham et al., 2023). For example, studies with detailed information on dietary choice have shown how central-place foragers adjust their foraging behaviour to changing prey conditions, exploiting different prey types and prey sizes (Montevecchi et al., 2009; Mullers et al., 2009; van Donk et al., 2019). The increasing number of possibilities to track individual birds has increased the number of studies to where seabirds collect their prey offshore (Burger and Shaffer, 2008; Thaxter et al., 2012). However, simultaneous information on prey distributions and seabird foraging behaviour is often lacking (but see Elliot et al., 2008).
Small forage fish at the surface are generally not targeted by dedicated fish surveys. They are often sampled concurrently with larger piscivorous species and thus with unsuitable gear types to adequately catch these forage fish (Lankowicz et al., 2020). This is certainly the case for patchy schooling fish such as sandeel species Ammodytidae and small herring/sprat Clupeidae, both very important parts of the diet of most West-European seabirds (Furness, 1990; Camphuysen and Garthe, 2000; Stienen, 2006). Sampling seabird diets instead provides researchers with information about the forage fish availability within the home ranges of these seabirds. A great diversity of methods are available to study seabird diets such as stomach, pellet and faecal sampling, direct observations, biochemical methods and bird-borne cameras (reviewed by Barrett et al., 2007; Bond and Jones, 2009; Williams and Buck, 2010; McInnes et al., 2017; Horswill et al., 2018; Edney and Wood, 2021). Similarly, there are also various methods to record the spatial distribution of seabirds during foraging trips such as VHF transmitters and GPS loggers (Wakefield et al., 2009). In combination, seabirds equipped with GPS-loggers could act as ‘living sampling equipment’ to spatially link habitat use to diet and thus the availability of prey items to foraging seabirds. Single-prey loading seabirds, such as terns Sternidae and some of the alcids Alcidae, are in this respect particularly useful since their prey items are visible (Peterson et al., 2018; Stienen et al., 2006) and the last foraging activity of a trip generally indicates the position of the captured prey items brought back to the colony (Perrow et al., 2017). In the past, various methods have been used to record prey items of single-prey loaders such as direct observations (Rodway and Montevecchi, 1996; Stienen et al., 2006; Elliott et al., 2008; Perrow et al., 2017), (digital) photography (Gaglio et al., 2017; Hornset, 2017) or video recording (Reif and Tornberg, 2006; Steen, 2009).
Here, we demonstrate a proof of concept of a combination of established methods to study the foraging ecology of seabirds, and the spatial availability of their prey items. By performing visual observations in the colony or recording digital video images of provisioned prey items of a single-prey loading seabird, the Sandwich Tern (Thalasseus sandvicensis), whilst concurrently tracking those individual birds with GPS-loggers, we were able to study various aspects of the distribution of both predator and prey. We highlight the potential of the combination of methods to study the spatial distribution of prey items. Furthermore, we give examples of the potential use of these methods to study seabird energetics. We illustrate how energy content of delivered prey items (energy yield per trip) is related to spatial variation of prey availability and to the energy expenditure per trip of adults taking into account various assumptions about self-provisioning activities of adults during the trip.
2.
Materials and methods
2.1
Study species and sites
In this study the Sandwich Tern was chosen as a model for a single-prey loading animal. Sandwich Terns are widely distributed along the European coasts and breed in the Baltic, North Sea, Irish Sea, Atlantic Ocean, Mediterranean, Black Sea and Caspian Sea. The largest colonies are in the Netherlands, UK, Germany and Denmark. The North Sea population of this species has a highly specialized diet whilst chick provisioning and it feeds almost exclusively on Clupeidae and Ammodytidae (Courtens et al., 2017) which are captured by dipping or plunge diving. Sandwich Terns capture and carry single prey items to their chicks during, for terns, relatively long trips far out at sea (Fijn et al. 2017).
Fieldwork was carried out in a Sandwich Tern colony at the Scheelhoek Nature Reserve (51.8124° N, 4.0728° E) within the Natura 2000-Special Protected Area Haringvliet in the south-western part of the Netherlands. This colony is situated on freshwater islands approximately 3 km away from the storm surge barrier Haringvlietdam which separated the North Sea from the freshwater lake Haringvliet. Each year the Scheelhoek colony holds approximately 1500–3500 breeding pairs in which breeding and foraging ecology are closely monitored.
2.2
GPS-tracking
In 2012–2013 and 2017, we captured suspected chick-feeding Sandwich Terns with walk-in traps on the nest and spring traps in the colony to be fitted with GPS-loggers for studies on habitat use in general (Fijn et al., 2017, 2024). Around a wider area where the nests of these birds were located, we constructed an enclosure to prevent the chicks from leaving the nesting area (c.f. Stienen et al., 2000). Captured birds were ringed with both a uniquely numbered metal ring and a field-readable plastic colour-ring. They were equipped with regular GPS-loggers in 2012–2015 (Ecotone ALLE GPS-UHF, ∼4 g, L × W × H = 35 mm × 15 mm × 8 mm) and three with proto-type GPS-loggers with solar panels in 2017 (Ecotone PICA GPS-UHF, ∼4.5 g, L × W × H = 35 mm × 15 mm × 10 mm). Loggers stored GPS positions with 5 (regular)–10 (solar) min intervals to the device memory and included date, time, latitude, longitude and GPS-speed. Regular loggers worked for approximately four days after deployment depending on GPS interval settings. Solar panel loggers recorded data for the entire breeding season. Data were automatically transferred to base stations placed in the colony from a distance up to ∼500 m. Based on flight direction, flight speed and habitat characteristics, individual GPS positions were classified into four categories: 1) Resting in and near colony; 2) Resting outside the colony; 3) Commuting to, in between and from the foraging area(s); 4) Foraging. Resting was defined as a combination of speed <0.5 m/s, and more than two subsequent fixes in proximity on solid ground. Commuting was defined as a straight-lined flight path away or towards the colony, or in between foraging bouts, and flight speeds >0.5 m/s. Foraging was defined as clustered positions in aquatic habitats and flight speeds >0.5 m/s. Great circle distances between individual fixes were calculated in ArcGIS (Esri, version 10.2). The duration of each trip was measured by calculating the time difference between departure and return to the colony. Some of the trips were incompletely recorded. If possible, trip duration was reconstructed from the great circle distance between the colony and the first recorded position and the average flight speed of outflying Sandwich Terns (37.3 km/h; Fijn and Gyimesi, 2018) assuming a straight line from the colony to the first position of the trip. A similar approach was applied if the last part of a trip was missing.
2.3
Visual observations
In 2012–2013 and 2017, the foraging ecology of Sandwich Terns was studied based on visual observations of prey deliveries from a hide next to the enclosure (see §2.2). In total, visual observations were collected over 113, 129 and 93 h in May to July in 2012, 2013 and 2017 respectively. Chicks in the enclosure were individually colour-coded with various combinations of dye to allow individual recognition during observations recording provisioning by adults. At least one adult of each pair was individually colour-coded using picric acid or silver-nitrate solution as well to allow identification. The enclosure ensured that the chicks remained in the vicinity of the observation hut, allowing monitoring of individual breeding pairs until the chicks fledge. Within the enclosures, prey items of returning non-tagged birds and tagged birds were recorded from the hide by an observer. We recorded prey species and total body length of the fish, based on the size of the fish relative to the measured bill length of the captured bird (see §2.5).
2.4
Video monitoring
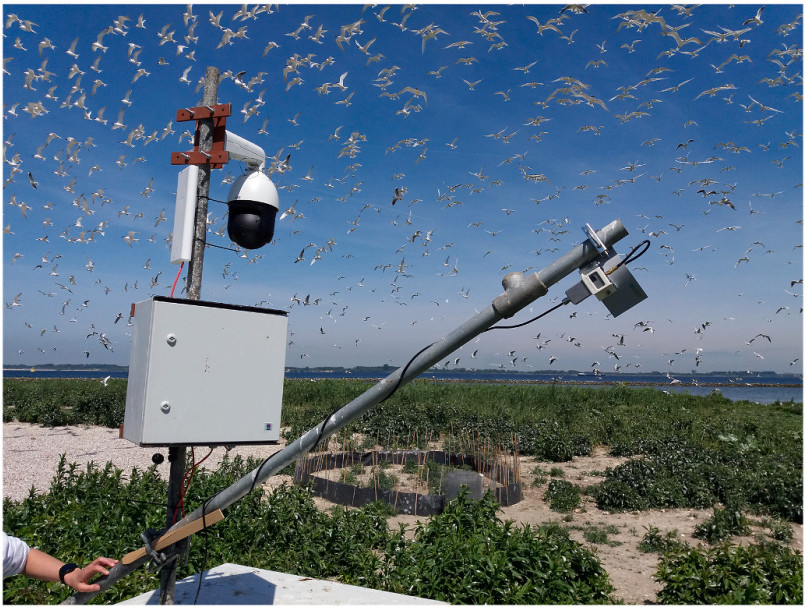
In 2017 we installed a PTZ (Pan Tilt Zoom) camera (HIKVision DS-2DE5220I-AE, Hangzhou Hikvision Digital Technology Co., Hangzhou, China) near the enclosure in the colony. The primary use of this camera was to record the breeding phenology and potential disturbances of Sandwich Terns, Black-headed Gulls (Chroicocephalus ridibundus), Avocets (Recurvirostra avosetta) and Ringed Plovers (Charadrius hiaticulata) in a separate project (Fig. 1). The camera started recording on May 19, 2017 until July 31, 2017. It recorded 24 h of video material per day, which was locally stored on a hard drive, but also transmitted via a 3G connection to be viewed on a computer or mobile device connected to internet. During the night infrared light illuminated the wider surrounding of the camera allowing nocturnal monitoring up to 25 m from the camera. Manual zooming or adjusting the program was possible via 3G.
Figure
1.
Camera setup and GPS-logger antenna at the Scheelhoek Nature Reserve (51°49′ N, 04°04′ E) in 2017. In the background Sandwich Terns and Black-headed Gulls as well as the enclosure where the GPS-tracked birds nested.
The camera was programmed to perform a scan along different areas of interest every 20 min. Since it recorded the Sandwich Tern enclosure for approximately 15 min each scan, these intervals were available to monitor prey deliveries of Sandwich Terns in the enclosure. Within the enclosure we deployed 10 GPS-loggers on chick-feeding birds (see §2.3). Camera time and the time of GPS-loggers were synchronized. Around the approximate return times of all recorded tracks, we searched in the video footage to look for prey deliveries (Fig. 2). Similar to the visual monitoring protocol, we recorded prey species and total body length of the fish (Fig. 2; see §2.5).
Figure
2.
Camera stills of parent and chick with the GPS-tag in the purple circle (A), overview of enclosure with prey delivery in the red circle (B), zoomed footage of and prey delivery in the blue circle (C) in 2017at Scheelhoek Nature Reserve. (For interpretation of the references to colour in this figure legend, the reader is referred to the Web version of this article.)
Since Sandwich Terns are single prey-loaders, they cannot forage beyond the capture of the prey item that is brought to the chick. As an approximate catch location of the recorded prey items, we assumed that the last GPS-location of an individual trip classified as ‘foraging’ represents the actual capture location of the prey item provisioned to the chick. Distances of prey captures to the colony were calculated by summing the shortest great circle distance over sea between the last foraging position and the colony. For some prey items (see Table 1) no full trips, and thus no foraging location, was recorded as these prey items were captured during very short trips (<15 min) with only 1 or 2 GPS positions. However, all delivered prey items were of marine origin and thus need to be either captured just across the Haringvlietdam (the sea barrier closest to the colony, 3.0 km away) or were kleptoparasited from a conspecific near the colony. Since we cannot be certain whether a prey item is captured or kleptoparasited, and we assumed that the capture location of these prey items was over marine habitat and thus at a distance of 3.0 km.
Table
1.
Recorded returns of tagged Sandwich Terns to the colony in 2017.
368
‘Returns’ to colony from GPS-loggers
63
No video footage of enclosure
51
During incubation (no prey)
63
After fledging (chick not in sight)
28
Due to prolonged disturbance
163
‘Returns’ to enclosure, potentially recorded by camera
19
Well after dark, no fish
12
Bird not visible on footage
132
Returns to enclosure after foraging trip
24
No fish seen, possibly kleptoparasitized
108
Recorded prey items
13
Kleptoparasitized by Black-headed Gull (11 Clupeidae, 2 Ammodytidae)
3
Kleptoparasitized by Sandwich Tern (3 Clupeidae)
6
Fish seen, but kleptoparasitized out of sight (3 Clupeidae, 3 Ammodytidae)
The total length (in cm) of each prey item was determined based on a visual assessment of size of the fish relative to the individual bill length of the adult bringing the fish to the colony (range: 5.1–5.8 cm) in classes of 0.5 bill length (c.f. Stienen and Brenninkmeijer, 2002).
2.7
Energy yield per trip
Energy yield per foraging trip was here defined as the amount of energy in kJ that a tagged adult brings to the chick per recorded foraging trip (time between leaving the colony and return). Energy content of prey items (E in kJ) is related to total fish length (TL, cm) following the equations in Stienen and Brenninkmeijer (2002):
Clupeidae:EClupeidae=0.03571×(TL2.996)
Ammodytidae:EAmmodytidae=0.01499×(TL2.982)
where the co-efficient has unit kJ per cm to the power of a species-group specific figure.
2.8
Energy expenditure per trip
Energy expenditure per foraging trip was here defined as the amount of energy in kJ that a tagged adult spends on flying per recorded foraging trip. Brenninkmeijer et al. (2002a) gives an empirically determined allometric relationship between Basic Metabolic Rate per minute (BMR/min in kJ/min), latitude where the animal is (L in degrees, here 52° N) and mass of the bird (M in g, here 238.9 g – average of tagged Sandwich Terns) as follows:
BMR=[(0.617+0.029×L)×M0.833]/1440
Energy expenditure per minute of Sandwich Terns was calculated for each foraging trip by summing the total time spent per activity class (see §2.2) multiplied by the BMR for each behavioural category. Behavioural categories that were recorded during foraging trips were: commuting to, in between and from the foraging area (s), foraging (all combined as ‘flying’) and resting on loafing sites outside the colony (‘resting’). As summarized by Brenninkmeijer et al. (2002a), terns have an energy expenditure during ‘resting’ and ‘flying’ of:
Eflying=4.77×(BMR/min)(EnergyexpenditureinkJ/min)
Eresting=1.62×(BMR/min)
2.9
Net energy balance per trip
The net energy balance per trip was here defined as the energy intake per trip by a tagged adult minus the expenditure per trip. To calculate energy intake of foraging adults per trip we first determined for each trip the duration of foraging. Then, we arbitrarily assume that Sandwich Terns spent half of their foraging time for self-provisioning and half of the time to search for a prey item for the chick. During this ‘self-provisioning’ foraging they capture 0.28 prey items per minute (based on the observation of a foraging efficiency of 17 fish per hour, (Brenninkmeijer et al 2022b). This results in a number of prey items for self-provisioning per trip. Energy content of these prey items was determined using the proportional distribution and average lengths of prey types in the adult diet (54.7% Clupeidae of 49 mm and 45.3% Ammodytidae of 106 mm) as reported for this colony by Courtens et al. (2017).
2.10
Statistical analysis
In this paper, we give examples of potential relationships between trip statistics and seabird energetics that can be studied with our experimental set-up. To account for potential autocorrelation due to the low number of individual birds and the uneven distribution of samples among individuals, we fitted mixed effect models with ‘individual’ as a random factor using the R package 'lme4' (Bates et al., 2015). P-values for mixed models were obtained using the package ‘lmerTest’ (Kuznetsova et al., 2017). To test for spatial patterns in the availability of different prey sizes at sea we used logarithmic data to investigate whether prey length of provisioned prey items was significantly related to catch distance of the prey item. We fit a log-linear model as adults can only carry prey items up to a certain length and chicks can only swallow items up to a certain size. In this model we included all trips for which a prey item was identified.
We used linear regression to determine whether prey items with a higher energy content require a larger energy expenditure per trip of the parents. In these analyses, we excluded the trips with trip durations over 380 min to remove outliers in trip duration. This 380 min threshold is the 1.5 × interquartile range (Iglewicz and Hoaglin, 1993) of the trip durations found by Fijn et al. (2017). This step is required to account for unrealistic energy expenditures during trips that were not only for foraging, but clearly also for other purposes such as prospecting or overnight stays away from the colony.
Since adult terns also self-provision during foraging trips, we were interested whether a relationship existed between the energy yield (in terms of delivered prey item) and the net energy balance of the adult (intake minus expenditure) per foraging trip. For this calculation we did several arbitrary assumptions for energy intake of self-provisioning adults (see §2.9) and again only trip durations shorter than 380 min were included.
All statistical analyses were carried out in R version 4.2.2 (R Core Team, 2022). For all models the significance of the models was tested, and we also visually tested the assumption of independent and identically distributed normal model residuals.
3.
Results
3.1
Geo-referenced prey items based on visual observations
During visual observation protocols in the enclosure, we recorded 1058 prey items that were provisioned to Sandwich Tern chicks in 2012 and 2013 combined. The composition of the provisioned diet was 72.8% Clupeidae (N = 770, average prey length 102 mm ± 21 SD), 20.7% Ammodytidae species (N = 219, average prey length 137 mm ± 27 SD) and 6.5% other species (N = 69).
Out of these prey items, 14 fish [10 Clupeidae (71%; average prey length 104 mm ± 16 SD, range: 81–131), 3 Ammodytidae (21%; average prey length 136 cm ± 24 SD, range: 109–149) and 1 Gobidae (7%) of 68 cm] were brought to the chicks by tagged birds (10 in 2012, 4 in 2013). An approximate catch location could be determined from the GPS data for seven of these fish (four Clupeidae, three Ammodytidae) (Table 2, Fig. 3). Although sample size is limited, smaller Clupeidae (average 90 mm) were caught relatively nearby (9.6 ± 1.8 km) on short trips (28 ± 10.4 min), whereas a larger Clupeidae (120 mm) was caught much further away (31 km) on a longer (incompletely recorded) trip of at least 112 min (Fig. 3). Both large Ammodytidae were caught further offshore (>32 km from colony) during long trips (>145 min). The smaller Ammodytidae was caught nearer to the colony (15 km) during a shorter trip of about an hour. For each tagged Sandwich Tern, the dates of capture, prey type, prey length, catch distance, trip duration and prey fate for all recorded prey items by observers in 2012 and 2013 are provided in Appendix Table S1.
Table
2.
Number of days that the GPS recorded data, observed returns with prey, and the number of herring/sprat (# Clup.) or sandeel (# Ammo) type prey for each individual Sandwich Tern in this study tagged at Scheelhoek in 2012 (B-rings), 2013 (W-ring) and 2017 (Y-rings). Furthermore, the fate of prey items is given; eaten by the chick (Chick), eaten by the parent itself (Adult), kleptoparasitized by a Black-headed Gull (Klepto gull), Sandwich Tern (Klepto tern) or by an unknown attacker (Klepto unknown). All catch locations are given in Fig. 2.
Ring
Type
GPS-days
Observed returns with prey
# Clup.
# Ammo.
Fate of prey
Chick
Adult
Klepto gull
Klepto tern
Klepto unknown
2012
B–N73
Regular
3
3
3
3
B–N75
Regular
6a
1
1
1
2013
W-NK3
Regular
6a
3
3
3
2017
Y-2.T1
Regular
4
6
4
2
5
1
Y-2.T4
Regular
5
7
6
1
7
Y-2.T5
Regular
5
3
3
3
Y–2S.5
Regular
2
2
1
1
2
Y–2S.6
Regular
2
4
2
2
4
Y–2S.7
Regular
5
2
1
1
1
1
Y–N50
Solar
36
74
58
16
57
1
10
1
5
Y–N52
Solar
14b
10
7
3
6
1
2
1
a Logger only part of the morning active. b Logger malfunctioned.
3.2
Geo-referenced prey items based on video observations
In 2017 a total of 545 prey items were recorded during visual observation protocols and Clupeidae constituted 58.2% of the delivered items to the colony (N = 317, average prey length 10.8 cm ± 2.2 SD), 34.7% were Ammodytidae (N = 289, average prey length 13.8 cm ± 3.0 SD), and 7.2% were other species (N = 39, average prey length 5.9 cm ± 3.2 SD). A total of 86% of all these prey items were fed to the chicks. The remaining 14% were either kleptoparasitized or (accidently) eaten by the parent.
In 2017, 368 returns of GPS-loggers into the colony were recorded by the camera (Table 1). For a total of 205 returns (56%) no prey items were recorded either because of camera failure, no sight on the enclosure, trips during incubation or after fledging, or ‘returns’ were not after a foraging trip, but after prolonged disturbance events. In 21 events (6%) we could not find the bird on the footage because of darkness or without a clear reason. On 24 of the 132 remaining returns after foraging trips the bird was not carrying a fish anymore, potentially due to kleptoparasitism of gulls or conspecifics out of view of the camera. In total 108 prey items were recorded on the footage. In 23 cases this prey item was not provisioned to the chick, the other were either kleptoparasitized or (accidently) eaten by the parent (Fig. 3, Table 1).
The composition of the prey items brought to the colony by tagged Sandwich Terns in 2017 was 76% Clupeidae and 24% Ammodytidae species. No other fish species were identified on the camera footage. Body lengths of provisioned fish were on average 8.3 ± 2.5 cm (range 5.1–13.9, N = 82) for Clupeidae and 8.7 ± 2.7 cm (range 5.1–14.2, N = 26) for Ammodytidae. A total of 85 of these prey items were fed to chicks, 22 were seen to be kleptoparasitized (13 by Black-headed Gull, 3 by another Sandwich Tern and 6 by an unknown other bird) or eaten by the adult itself.
Almost all prey items recorded on video were captured north of the colony (Fig. 4). Forty prey items were caught on very short trips (<15 min) and were either captured close to the colony, for example in the shallow waters of the Kwade Hoek (51.8389° N, 4.0219° E), at the barrier between Haringvliet and the sea (51.8296° N, 4.0442° E), or kleptoparasitized from other Sandwich Terns near the colony. Most Clupeidae (trip duration: 100 ± 100 cm, range: 5–354) were captured north of the colony, on average 26 km away but ranging until almost 65 km. All Ammodytidae were captured during trips of 99 ± 106 min (range: 5–309) about 30–35 km northwest of the colony ranging up to 79 km away. Most smaller prey items were captured within 20 km of the colony. (Fig. 3). For each tagged Sandwich Tern the dates of capture, prey type, prey length, catch distance, trip duration and prey fate are given for all prey items recorded by video observations in 2017 is provided in Appendix Table S1.
Figure
4.
Prey length (cm) per catch distances (km) to the colony over sea of Sandwich Terns from the Scheelhoek colony for trips with identified prey items. Larger prey items with higher energetic levels of both Clupeidae and Ammodytidae were captured at longer distances from the colony. Logarithmic regression lines including 95% confidence limits (grey shading) are shown for Clupeidae and Ammodytidae separately.
Logarithmic regression was used to test whether the size of provisioned prey items was significantly related to catch distance. Larger Clupeidae (t-value = 4.19, df = 78.9, p < 0.001) and Ammodytidae (t-value = 4.45, df = 26.9, p < 0.001) prey items were captured at further distances from the colony (Fig. 4). These larger food items were not only caught at larger distances, but during longer trips. Consequently, prey items with a higher energy content were captured during trips with a higher energetic expenditure of the adults, again for both Clupeidae (t-value = −3.77, df = 70.9, p < 0.001) and Ammodytidae (t-value = −3.49, df = 21.9, p = 0.002) prey items (Fig. 5). Taking our assumptions (§2.9) into account, we found that adults generally spend more energy on a trip, than they provision to the chick (Fig. 6). Moreover, there was no relationship between the energy content of delivered prey items and the net energy balance of an adult during a foraging trip for both Clupeidae (t-value = −0.72, df = 76.7, p = 0.454) or Ammodytidae (t-value = −1.09, df = 24.9, p = 0.285).
Figure
5.
Energetic content of prey items (kJ) and energetic costs of adults (kJ) of Sandwich Terns from the Scheelhoek colony for trips with identified prey items. Larger prey items with higher energetic levels of both Clupeidae and Ammodytidae required a significantly higher energetic cost for adults. Linear regression lines including 95% confidence limits (grey shading) are shown for Clupeidae and Ammodytidae separately.
Figure
6.
Energetic content of prey items (kJ) and net energy balance of adults (kJ) of Sandwich Terns from the Scheelhoek colony for trips with identified prey items. Provisioned prey items were captured on trips under the assumption that adults foraged 50% of the foraging time for self-provisioning and 50% for the chick. Linear regression lines including 95% confidence limits (grey shading) are shown for Clupeidae and Ammodytidae separately. Dashed lines indicate non-significance. The horizontal line indicates an energy balance of the adult between energy expenditure and intake.
We combined two established methods (prey delivery monitoring and GPS-tracking) to study the spatial distribution of captured prey items and foraging trip energetics of Sandwich Terns. By combining these data sources, we not only obtained detailed knowledge on the whereabouts and chick diets of tracked birds, but also on the spatial origin and energy contents of delivered prey items as well as insight in energetic expenditure and yield during trips. Realizing that caution is needed when interpreting the GPS data to determine catch locations (see below), we found that smaller prey items were captured closer to the colony and that high energy prey items were captured on longer trips further away. We show that these trips are energetically more costly for adults, which is probably compensated by self-provisioning along the way.
The use of photography and video is widely used to study nesting behaviour (e.g., Huffeldt and Merkel, 2013; Lynch et al., 2015) and diet (e.g., Kross and Nelson, 2011; Gaglio et al., 2018) of many different species of birds and mammals. Similarly, numerous tracking studies are done to determine foraging habitats (e.g., McLeay et al., 2010; Rolland et al., 2020; Beal et al., 2021). However, both methods have only rarely been used to link foraging habitat of seabirds to captured prey species (but see Sugishita et al., 2015; Christensen-Dalgaard, 2018). Alternative techniques to identify seabird foraging habitat and link foraging habitat to captured prey species are visual tracking at sea (Perrow et al., 2017) and the use of animal borne cameras together with GPS tracking (Sakamoto et al., 2009; Votier et al., 2013; Michel et al., 2022). An advantage of these latter methods could be the ability to distinguish foraging for self-provisioning and chick-feeding, although only on species that carry prey items visible in their beaks. Drawbacks of these methods are that they are either very time consuming and expensive (visual tracking) or only applicable to larger species (animal borne cameras). We show that combining photography/video in the colony and GPS to pinpoint catch locations of prey items has great potential as a detailed and continuous method to study the spatial prey availability for visible prey-loading species.
Behaviour of Sandwich Terns, and thus also foraging areas and ultimately the catch location used in this study, was based on a visual assessment of GPS-positions during a trip. Since sampling intervals are 5 or 10 min apart, the precise location of capture comes with an error up to 5 km taking an average flight speed during foraging of 30 km/h (Fijn and Gyimesi, 2018). Furthermore, there was no evidence that the actual capture locations were in fact the last foraging position of a track. The possibility remains that the actual capture of the prey item was along the homing bout of a foraging trip without search behaviour being recorded by the logger. Therefore, all capture locations in our study should be treated with caution and only as indicative of the most likely capture location based on the data. A possible technological advance to overcome this in terns would the inclusion of accelerometer data to record actual dives (Poupart et al., 2020; van Donk et al., 2020; Conners et al., 2021; Ma et al., 2022). However, these sensors are not yet sufficiently small to be included in GPS-loggers that can be carried by Sandwich Terns but are available for larger tern species and larger seabirds in general. In addition, a combination of GPS and time-depth recorders can also record foraging locations, however, only for deeper diving species than terns (Evans et al., 2013; Bennet et al., 2019). Whether these dives are successful or not, is unknown in this setup, but this could be established by using stomach temperature sensors (Kato et al., 1996; Garthe et al., 2007) that show lower temperature signatures during prey ingestion. Focusing again on terns, these can only be used to record foraging for self-provisioning as prey items for chicks are not swallowed.
Visual observations of prey items by observers in the field are a very effective way to determine prey deliveries and foraging durations of Sandwich Terns. Observers can determine prey species and lengths from a nearby hide and estimate trip duration from departures and arrivals of individually marked birds. However, combining visual observations of prey deliveries and tagging led to relatively few matches between delivered prey items and recorded trips in our study. This was the result of a combination of the short battery life of the GPS loggers in our study (max 350 GPS-positions taken) and limited opportunities to do continuous observations of chick provisioning by observers right after tagging. The great advantage of camera monitoring is the continuity of observations that cannot be achieved with observers unless a large pool of observers can perform consecutive continuous observations. Another benefit of the camera footage is the ability to monitor colony activity at night which cannot be done from the hide. This is not relevant when studying foraging ecology but will provide additional information on other aspects of the breeding ecology. A further benefit of camera monitoring is the ability to review footage and thus prey deliveries. Observers in the colony can miss prey deliveries occasionally and camera monitoring can overcome this bias. However, camera monitoring has its weaknesses as well with regards to identification and length estimates which are discussed below.
In our study, 79% of all prey items were delivered to chicks, which is similar to the 86% as found during the visual observations in this study, and 70% (64–81%) found by Stienen et al. (2001) in a colony in the north of the Netherlands. Our figures are however probably an overestimate as kleptoparasitic events out of sight of the observers and camera were not recorded in our data and are probably included in the group of recorded returns without a fish. These kleptoparasitic events probably have a profound effect on energetics of breeding adults. Prey lengths of provisioned items were similar between the tagged and non-tagged birds in 2012 and 2013. In 2017 the lengths of Clupeidae prey items were smaller for the prey items recorded by camera than the visually recorded items. This difference was even larger for Ammodytidae prey. Since both methods were not done by the same people, we cannot fully exclude that either one of the methods over- or underestimates prey lengths consistently, but the reason for this bias remains unknown. Determining the size of a prey item relative to the size of the beak of the bird is challenging, even when observed from close range or recorded with a camera. The movement of birds and fish, the position of the fish at different angles in the beak, and varying light conditions can hamper consistent measurements. Estimating fish size from measurements of only parts of the body of the prey item (c.f. Engvall et al., 2022) can be a solution although this is probably only suited for photography or video monitoring.
In 2012 and 2013 the species-specific proportions of prey items were 72% Clupeidae, 20% Ammodytidae and 8% ‘other species’ in untagged Sandwich Terns and respectively 71, 21 and 7% for tagged birds. In 2017, we recorded 58% Clupeidae, 35% Ammodytidae and 7% other during visual observations whilst diet composition on the camera footage was 76% Clupeidae and 24% Ammodytidae in that year. Variation in proportions of prey species is common among individual adults (Courtens et al., 2017; Fijn et al., 2019) and the reason for the discrepancy between our results is probably that the majority of recorded prey items on the footage belong to one individual. However, it is remarkable that no ‘other’ prey items were recorded on the video footage as these prey items are often found in Sandwich Tern studies (Stienen, 2006; Courtens et al., 2017; Fijn et al., 2019). A possible explanation is that our small sample size of tagged birds, might not have included individuals that regularly target other prey items. Another potential explanation is that the camera footage is of insufficient quality to the observers to accurately record these other fish species. Potentially, this could be a major drawback when this methodology is used on bird species with a much more diverse diet of fish species with more similar appearance. At the moment we feel that visual observers are likely to be better in determining prey species and estimating prey size in the field. In the future, the advancements of cameras and machine learning techniques may open up possibilities to automatically filter prey deliveries as well (Kabra et al., 2022).
Similar to the prey deliveries of untagged birds (W. Courtens in prep.), larger prey items of tagged Sandwich Terns were caught further away from the colony and during longer trips indicating spatial patterns in prey size distribution and a larger energetic investment of adults for high caloric prey items. Spatial variation in fish size has been found with larger herring occurring further offshore than smaller conspecifics (e.g., Townsend, 1992; Andrews Ⅲ et al., 2016), however, these findings are on a much larger spatial scale than in our study. Our study suggests that these patterns also occur on a smaller spatial scale. The higher energetic investment for higher energetic prey items suggests that parents might need to work harder when the energy demand of the chick is higher later in the season as was found for Sandwich Terns in previous studies (Stienen et al., 2015) and several other seabird species (Weimerskirch et al., 2003; Welcker et al., 2010; van Donk et al., 2019). It is likely that this increased energy expenditure of adults is compensated by self-provisioning along the way.
Our study demonstrates the proof of concept of a combination of established methods to study the spatial distribution of captured prey items and foraging strategies of seabirds with which various aspects of seabird energetics can be modelled. Such studies are of interest in many taxa in both a fundamental and applied context (Masden et al., 2010; Fort et al., 2011; Collins et al., 2016). Our methodology can be applied to all birds and other animals that can carry a GPS-logger and carry prey items visibly with thus a great research potential to study many aspects of the foraging ecology and energetics of provisioning animals. The ability to identify prey items, measure their size and thus estimate their energetic value, connected to movement characteristics of the foraging trip, allows the modelling of the energetics of trip expenditure and input to the chick. Ultimately, this could improve our understanding of the feeding ecology of seabirds and the strategies and trade-offs they must consider to successfully raise a chick.
Ethics statement
All work was carried under all the required legal requirements. A license to access the nature reserve was granted by site staff of Natuurmonumenten. Ringing licences were granted by the Vogeltrekstation, Netherlands. Tracking of Sandwich Terns was performed under project licence for animal procedures AVD401002015102 of the Central Authority for Scientific Procedures on Animals, the Netherlands.
CRediT authorship contribution statement
Ruben C. Fijn: Writing – original draft, Visualization, Validation, Project administration, Methodology, Investigation, Funding acquisition, Formal analysis, Data curation, Conceptualization. Wouter Courtens: Writing – original draft, Methodology, Investigation, Conceptualization. Bas W.R. Engels: Writing – original draft, Investigation. Emiel E. van Loon: Writing – original draft, Supervision, Methodology. Judy Shamoun-Baranes: Writing – original draft, Supervision, Methodology.
Declaration of competing interest
The authors declare that they have no known competing financial interests or personal relationships that could have appeared to influence the work reported in this paper.
Acknowledgements
GPS-tracking of Sandwich Terns was part of the monitoring programme into the effects of the compensation measures designed for the construction of the seaward expansion of the Rotterdam Harbour (‘Tweede Maasvlakte’). This programme (PMR-NCV) was initiated by the Dutch Ministry of Infrastructure and the Environment and commissioned by Rijkswaterstaat WVL (M. van Eerden, K. Borst). Bureau Waardenburg (BW), the Research Institute for Nature and Forest (INBO), and Deltamilieu Projecten (DMP) carried out the research on terns within a project commissioned by Wageningen Marine Research (a.o. I. Tulp) and Deltares (a.o. T. Prins). Tracking of Sandwich Terns was performed under project licence for animal procedures AVD401002015102 of the Central Authority for Scientific Procedures on Animals. Camera monitoring was part of a research grant to DMP and BW by Vogelbescherming Nederland. Project manager was F. Arts (DMP) and he is greatly thanked for his input. Fieldwork in both projects was carried in a nature reserve of Natuurmonumenten and W. van Steenis, H. Meerman, J. de Roon and M. Broere are specifically acknowledged for their cooperation and hospitality. The authors would like to thank T. Boudewijn, J. de Jong, E. Bravo Rebolledo, A. Gyimesi, M. Poot (BW), E. Stienen, H. Verstraete, M. Van der walle and N. Vanermen (INBO) for help in the field. The INBO team is specifically thanked for their observations of prey items. R. Middelveld (BW) is thanked for providing the map with foraging locations. The comments of two anonymous referees and Giacomo Dell'Omo greatly improved this manuscript.
Andrews Ⅲ, A.G., Strasburger, W.W., Farley Jr, E.V., Murphy, J.M., Coyle, K.O., 2016. Effects of warm and cold climate conditions on capelin (Mallotus villosus) and Pacific herring (Clupea pallasii) in the eastern Bering Sea. Deep Sea Res. Part Ⅱ 134, 235–246. .
Barrett, R.T., Camphuysen, K., Anker-Nilssen, T., Chardine, J.W., Furness, R.W., Garthe, S., et al., 2007. Diet studies of seabirds: a review and recommendations. ICES J. Mar. Sci. 64, 1675–1691. .
Bates, D., Mächler, M., Bolker, B., Walker, S., 2015. Fitting linear mixed-effects models using the lme4 package in R. J. Stat. Software 67, 1–48.
Beal, M., Byholm, P., Lötberg, U., Evans, T.J., Shiomi, K., Åkesson, S., 2021. Habitat selection and foraging site fidelity in Caspian Terns (Hydroprogne caspia) breeding in the Baltic Sea. Ornis Fenn. 98, 128–141.
Bennet, D.G., Horton, T.W., Goldstien, S.J., Rowe, L., Briskie, J.V., 2019. Flying south: foraging locations of the Hutton's shearwater (Puffinus huttoni) revealed by Time‐Depth Recorders and GPS tracking. Ecol. Evol. 9, 7914–7927. .
Bicknell, A.W., Oro, D., Camphuysen, K., Votier, S.C., 2013. Potential consequences of discard reform for seabird communities. J. Appl. Ecol. 50, 649–658.
Bond, A.L., Jones, I.L., 2009. A practical introduction to stable-isotope analysis for seabird biologists: approaches, cautions and caveats. Mar. Ornithol. 37, 183–188.
Brenninkmeijer, A., Stienen, E.W.M., Klaassen, M., Kersten, M., 2002a. Feeding ecology of wintering terns in Guinea Bissau. Ibis 144, 602–613. .
Brenninkmeijer, A., Doeglas, G., De Fouw, J., 2002b. Foerageergedrag van sterns in de
westelijke Westerschelde in 2002. Altenburg en Wymenga rapport 346. Feanwâlden,
Netherlands.
Buckingham, L., Daunt, F., Bogdanova, M.I., Furness, R.W., Bennett, S., Duckworth, J., et al., 2023. Energetic synchrony throughout the non‐breeding season in common guillemots from four colonies. J. Avian Biol. 2023, e03018 .
Burger, A.E., Shaffer, S.A., 2008. Perspectives in ornithology application of tracking and data-logging technology in research and conservation of seabirds. Auk 125, 253–264. .
Camphuysen, C.J., Garthe, S., 2000. Seabirds and commercial fisheries: population
trends of piscivorous seabirds explained. In: Kaiser, M.J., de Groot, S.J. (Eds.), The
Effects Offishing on Non-target Species and Habitats: Biological, Conservation and
Socio-Economic Issues. Blackwell, pp. 163–184.
Christensen-Dalgaard, S., 2018. Drivers of Seabird Spatial Ecology – Implications for
Development of Offshore Wind-Power in Norway. PhD thesis. Norwegian University
of Science and Technology, Trondheim, Norway.
Collins, P.M., Halsey, L.G., Arnould, J.P., Shaw, P.J., Dodd, S., Green, J.A., 2016. Energetic consequences of time‐activity budgets for a breeding seabird. J. Zool. 300, 153–162. .
Conners, M.G., Michelot, T., Heywood, E.I., Orben, R.A., Phillips, R.A., Vyssotski, A.L., et al., 2021. Hidden Markov models identify major movement modes in accelerometer and magnetometer data from four albatross species. Mov. Ecol. 9, 7.
Courtens, W., Verstraete, H., Vanermen, N., Stienen, E.W.M., 2017. Faecal samples reveal the diet of breeding adult Sandwich terns Thalasseus sandvicensis in Belgium and the southern part of The Netherlands. J. Sea. Res. 127, 182–193.
Edney, A.J., Wood, M.J., 2021. Applications of digital imaging and analysis in seabird monitoring and research. Ibis 163, 317–337.
Ellis, H.I., Gabrielsen, G.W., 2002. Energetics of free-ranging seabirds. In: Schreiber, B.
A., Burger, J. (Eds.), Biology of Marine Birds. CRC Press, Boca Raton, pp. 359–407.
Engvall, E., Waldenström, J., Hentati-Sundberg, J., 2022. Diet and prey size preference in Razorbills Alca torda breeding at Stora Karlsö, Sweden. Ornis Svec. 32, 87–98.
Evans, T.J., Kadin, M., Olsson, O., Åkesson, S., 2013. Foraging behaviour of common murres in the Baltic Sea, recorded by simultaneous attachment of GPS and time-depth recorder devices. Mar. Ecol. Prog. Ser. 475, 277–289.
Fijn, R.C., de Jong, J., Courtens, W., Verstraete, H., Stienen, E.W.M., Poot, M.J.M., 2017. GPS-tracking and colony observations reveal variation in offshore habitat use and foraging ecology of breeding Sandwich Terns. J. Sea Res. 127, 203–211.
Fijn, R.C., Gyimesi, A., 2018. Behaviour related flight speeds of Sandwich Terns and their implications for wind farm collision rate modelling and impact assessment. Environ. Impact Assess. Rev. 71, 12–16.
Fijn, R.C., Courtens, W., Arts, F.A., Daelemans, R., Grutters, B., et al., 2019. PMR-NCV onderzoek sterns in de Delta en Voordelta. Bureau Waardenburg Rapportnr , 17–247.
Fijn, R.C., Van Bemmelen, R.S.A., Collier, M.P., van Loon, E.E., Poot, M.J.M., Shamoun-Baranes, J., 2024. Evaluation of tag attachment techniques for plunge-diving terns. Ibis 166, 1003–1022.
Fort, J., Porter, W.P., Grémillet, D., 2011. Energetic modelling: a comparison of the different approaches used in seabirds. Comp. Biochem. Physiol. A 158, 358–365.
Furness, R.W., 1990. A preliminary assessment of the quantities of Shetland sandeels taken by seabirds, seals, predatory fish and the industrial fishery in 1981–83. Ibis 132, 205–217.
Furness, R.W., Camphuysen, K., 1997. Seabirds as monitors of the marine environment. ICES J. Mar. Sci. 54, 726–737.
Gaglio, D., Cook, T.R., Connan, M., Ryan, P.G., Sherley, R.B., 2017. Dietary studies in birds: testing a non invasive method using digital photography in seabirds. Methods Ecol. Evol. 8, 214–222.
Gaglio, D., Cook, T.R., McInnes, A., Sherley, R.B., Ryan, P.G., 2018. Foraging plasticity in seabirds: a non-invasive study of the diet of greater crested terns breeding in the Benguela region. PLoS One 13, e0190444.
Garthe, S., Montevecchi, W.A., Davoren, G.K., 2007. Flight destinations and foraging behaviour of northern gannets (Sula bassana) preying on a small forage fish in a low-Arctic ecosystem. Deep Sea Res. Part Ⅱ 54, 311–320.
Hornset, K., 2017. Monitoring Daily Activity and Parental Food Provisioning in the
Atlantic Puffin (Fratercula Arctica) by the Use of Camera Traps. MSc.-thesis.
Norwegian University of Life Sciences, Ås, Norway.
Horswill, C., Jackson, J.A., Medeiros, R., Nowell, R.W., Trathan, P.N., O'Connell, T.C., 2018. Minimising the limitations of using dietary analysis to assess foodweb changes by combining multiple techniques. Ecol. Indicat. 94, 218–225.
Huffeldt, N.P., Merkel, F.R., 2013. Remote time-lapse photography as a monitoring tool for colonial breeding seabirds: a case study using thick-billed murres (Uria lomvia). Waterbirds 36, 330–341.
Iglewicz, B., Hoaglin, D.C., 1993. How to Detect and Handle Outliers. ASQC Quality Press, Milwaukee.
Kabra, K., Xiong, A., Li, W., Luo, M., Lu, W., Garcia, R., et al., 2022. Deep object
detection for waterbird monitoring using aerial imagery. In: 2022 21st IEEE
International Conference on Machine Learning and Applications (ICMLA),
pp. 455–460. Nassau, Bahamas, 2022.
Kato, A., Naito, Y., Watanuki, Y., Shaughnessy, P.D., 1996. Diving pattern and stomach temperatures of foraging king cormorants at subantarctic Macquarie Island. Condor 98, 844–848.
Kross, S.M., Nelson, X.J., 2011. A portable low-cost remote videography system for monitoring wildlife. Methods Ecol. Evol. 2, 191–196.
Kuznetsova, A., Brockhoff, P.B., Christensen, R.H.B., 2017. lmerTest package: tests in linear mixed effects models. J. Stat. Software 82, 1–26.
Lankowicz, K.M., Bi, H., Liang, D., Fan, C., 2020. Sonar imaging surveys fill data gaps in forage fish populations in shallow estuarine tributaries. Fish. Res. 226, 105520.
Lynch, T.P., Alderman, R., Hobday, A.J., 2015. A high-resolution panorama camera system for monitoring colony-wide seabird nesting behaviour. Methods Ecol. Evol. 6, 491–499.
Ma, R., Kazama, K., Yasutake, Y.C., Kazama, M.T., Tsukamoto, S., Watanuki, Y., 2022. Dynamic body acceleration improves mapping of at‐sea foraging behavior in black‐tailed gulls Larus crassirostris. J. Avian Biol. 2022, e02869.
Masden, E.A., Haydon, D.T., Fox, A.D., Furness, R.W., 2010. Barriers to movement: modelling energetic costs of avoiding marine wind farms amongst breeding seabirds. Mar. Pollut. Bull. 60, 1085–1091.
McInnes, J.C., Jarman, S.N., Lea, M.A., Raymond, B., Deagle, B.E., Phillips, R.A., et al., 2017. DNA metabarcoding as a marine conservation and management tool: a circumpolar examination of fishery discards in the diet of threatened albatrosses. Front. Mar. Sci. 4, 277.
McLeay, L.J., Page, B., Goldsworthy, S.D., Paton, D.C., Teixeira, C., Burch, P., et al., 2010. Foraging behaviour and habitat use of a short-ranging seabird, the crested tern. Mar. Ecol.: Prog. Ser. 411, 271–283.
Michel, L., Cianchetti-Benedetti, M., Catoni, C., Dell'Omo, G., 2022. How shearwaters prey. New insights in foraging behaviour and marine foraging associations using bird-borne video cameras. Mar. Biol. 169, 7.
Montevecchi, W.A., Myers, A., 1996. Dietary changes of seabirds indicate shifts in pelagic food webs. Sarsia 80, 313–322.
Montevecchi, W.A., Benvenuti, S., Garthe, S., Davoren, G.K., Fifield, D., 2009. Flexible foraging tactics by a large opportunistic seabird preying on forage-and large pelagic fishes. Mar. Ecol.: Prog. Ser. 385, 295–306.
Mullers, R.H., Navarro, R.A., Daan, S., Tinbergen, J.M., Meijer, H.A., 2009. Energetic costs of foraging in breeding Cape gannets Morus capensis. Mar. Ecol.: Prog. Ser. 393, 161–171.
Parsons, M., Mitchell, I., Butler, A., Ratcliffe, N., Frederiksen, M., Foster, S., et al., 2008. Seabirds as indicators of the marine environment. ICES J. Mar. Sci. 65, 1520–1526.
Perrow, M., Harwood, A., Berridge, R., Skeate, E., 2017. The foraging ecology of Sandwich Terns in north Norfolk. Br. Birds 110, 249–308.
Peterson, S.H., Ackerman, J.T., Eagles-Smith, C.A., Herzog, M.P., Hartman, C.A., 2018. Prey fish returned to Forster's tern colonies suggest spatial and temporal differences in fish composition and availability. PLoS One 13, e0193430. .
Poupart, T.A., Waugh, S.M., Kato, A., Arnould, J.P., 2020. Foraging niche overlap during chick-rearing in the sexually dimorphic Westland petrel. R. Soc. Open Sci. 7, 191511.
R Core Team, 2022. R: A Language and Environment for Statistical Computing. R
Foundation for Statistical Computing, Vienna, Austria. .
Reif, V., Tornberg, R., 2006. Using time-lapse digital video recording for a nesting study of birds of prey. Eur. J. Wildl. Res. 52, 251–258.
Rodway, M.S., Montevecchi, W.A., 1996. Sampling methods for assessing the diets of Atlantic puffin chicks. Mar. Ecol.: Prog. Ser. 144, 41–55.
Rolland, V., Nepshinsky, M., Windhoffer, E.D., Liechty, J.S., Minor, A.K., Pierce, A.R., 2020. Identification of foraging areas and movements of royal tern Thalasseus maximus at the isles dernieres barrier islands refuge, Louisiana. Mar. Ornithol. 48, 163–168.
Sakamoto, K.Q., Takahashi, A., Iwata, T., Trathan, P.N., 2009. From the eye of the albatrosses: a bird-borne camera shows an association between albatrosses and a killer whale in the Southern Ocean. PLoS One 4, e7322.
Steen, R., 2009. A portable digital video surveillance system to monitor prey deliveries at raptor nests. J. Raptor Res. 43, 69–75.
Stienen, E.W.M., 2006. Living with Gulls. Trading off Food and Predation in the
Sandwich Tern Sterna sandvicensis. Ph.D Thesis. Rijksuniversiteit Groningen.
Stienen, E.W.M., van Beers, P.W., Brenninkmeijer, A., Habraken, J.M.P.M., Raaijmakers, M.H.J.E., van Tienen, P.G., 2000. Reflections of a specialist: patterns in food provisioning and foraging conditions in Sandwich Terns Sterna sandvicensis. Ardea 88, 33–49.
Stienen, E.W.M., Brenninkmeijer, A., Geschiere, C.E., 2001. Living with gulls: the consequences for Sandwich terns of breeding in association with black-headed gulls. Waterbirds 24, 68–82.
Stienen, E.W.M., Brenninkmeijer, A., 2002. Foraging decisions of Sandwich Terns in the presence of kleptoparasitising gulls. Auk 119, 473–486.
Stienen, E.W.M., Brenninkmeijer, A., Courtens, W., 2015. Intra-specific plasticity in parental investment in a long-lived single-prey loader. J. Ornithol. 156, 699–710.
Sugishita, J., Torres, L.G., Seddon, P.J., 2015. A new approach to study of seabird-fishery overlap: connecting chick feeding with parental foraging and overlap with fishing vessels. Glob. Ecol. Conserv. 4, 632–644.
Thaxter, C.B., Lascelles, B., Sugar, K., Cook, A.S.C.P., Roos, S., Bolton, M., et al., 2012. Seabird foraging ranges as a preliminary tool for identifying candidate Marine Protected Areas. Biol. Conserv. 156, 53–61.
Townsend, D.W., 1992. Ecology of larval herring in relation to the oceanography of the Gulf of Maine. J. Plankton Res. 14, 467–493.
van Donk, S., Shamoun-Baranes, J., van der Meer, J., Camphuysen, K.C., 2019. Foraging for high caloric anthropogenic prey is energetically costly. Mov. Ecol 7, 17.
van Donk, S., Shamoun‐Baranes, J., Bouten, W., van der Meer, J., Camphuysen, K.C., 2020. Individual differences in foraging site fidelity are not related to time‐activity budgets in Herring Gulls. Ibis 162, 429–445.
van Franeker, J.A., 2001. Mirrors in Ice. Fulmarine Petrels and Antartic Ecosystems. Ph.D
Thesis. University of Groningen, Groningen, Netherlands.
Votier, S.C., Bicknell, A., Cox, S.L., Scales, K.L., Patrick, S.C., 2013. A bird's eye view of discard reforms: bird-borne cameras reveal seabird/fishery interactions. PLoS One 8, e57376.
Wakefield, E.D., Phillips, R.A., Matthiopoulos, J., 2009. Quantifying habitat use and preferences of pelagic seabirds using individual movement data: a review. Mar. Ecol. Prog. Ser. 391, 165–182.
Williams, C.T., Buck, C.L., 2010. Using fatty acids as dietary tracers in seabird trophic ecology: theory, application and limitations. J. Ornithol. 151, 531–543.
Weimerskirch, H., Ancel, A., Caloin, M., Zahariev, A., Spagiari, J., Kersten, M., et al., 2003. Foraging efficiency and adjustment of energy expenditure in a pelagic seabird provisioning its chick. J. Anim. Ecol. 72, 500–508.
Welcker, J., Moe, B., Bech, C., Fyhn, M., Schultner, J., Speakman, J.R., et al., 2010. Evidence for an intrinsic energetic ceiling in free‐ranging kittiwakes Rissa tridactyla. J. Anim. Ecol. 79, 205–213.
Table
2.
Number of days that the GPS recorded data, observed returns with prey, and the number of herring/sprat (# Clup.) or sandeel (# Ammo) type prey for each individual Sandwich Tern in this study tagged at Scheelhoek in 2012 (B-rings), 2013 (W-ring) and 2017 (Y-rings). Furthermore, the fate of prey items is given; eaten by the chick (Chick), eaten by the parent itself (Adult), kleptoparasitized by a Black-headed Gull (Klepto gull), Sandwich Tern (Klepto tern) or by an unknown attacker (Klepto unknown). All catch locations are given in Fig. 2.
Ring
Type
GPS-days
Observed returns with prey
# Clup.
# Ammo.
Fate of prey
Chick
Adult
Klepto gull
Klepto tern
Klepto unknown
2012
B–N73
Regular
3
3
3
3
B–N75
Regular
6a
1
1
1
2013
W-NK3
Regular
6a
3
3
3
2017
Y-2.T1
Regular
4
6
4
2
5
1
Y-2.T4
Regular
5
7
6
1
7
Y-2.T5
Regular
5
3
3
3
Y–2S.5
Regular
2
2
1
1
2
Y–2S.6
Regular
2
4
2
2
4
Y–2S.7
Regular
5
2
1
1
1
1
Y–N50
Solar
36
74
58
16
57
1
10
1
5
Y–N52
Solar
14b
10
7
3
6
1
2
1
a Logger only part of the morning active. b Logger malfunctioned.

 DownLoad:


 Email Alerts
 RSS Feeds