Departamento de Ecología, Genética y Evolución (EGE) and Instituto de Ecología, Genética y Evolución de Buenos Aires (IEGEBA), CONICET, Facultad de Ciencias Exactas y Naturales, Universidad de Buenos Aires, Pabellón Ⅱ Ciudad Universitaria, C1428EGA, Ciudad Autónoma de Buenos Aires, Argentina
Funds: This work was supported by a grant from the National Agency for the Promotion of Science and Technology of Argentina (grant PICT, 2017–1996 to AGL), and by two awards, one from the Association of Field Ornithologists and the other from Aves Argentinas to MDC
The study of parental food provisioning is essential for understanding the breeding ecology of birds. We conducted the first study using accelerometry to detect food provisioning in birds, using Support Vector Machine (SVM) models to identify when adults feed chicks of three different age classes. Accelerometers were attached to the head of adult female Imperial Shags (Leucocarbo atriceps), and various attributes derived from the acceleration signals were used to train SVM models for each chick age class. Model performance improved with chick age class, with SVM models achieving high overall accuracy (> 88%) and highest sensitivity in older chick categories (> 91%). However, precision values, especially for younger chicks, remained relatively low (between 26% and 45%). The application of a time filter based on the minimum duration of the observed food provisioning behaviours for each chick age category, improved model performance by reducing false provisioning behaviours, particularly in the model for older chicks, which showed the highest precision (72.4%). This study highlights the effectiveness of accelerometry and machine learning in studying parental food provisioning in birds, providing a rapid and accurate data collection method to complement traditional techniques. The described methodology can be applied to any bird species that exhibits distinctive movements while feeding its offspring and has suitable characteristics for attaching an accelerometer to the body part that best captures this movement. Finally, it is hoped that the results of this study will contribute to future research on key questions in parental investment theory and reproductive strategies in birds.
Monitoring parental food provisioning is essential for understanding key aspects of evolutionary and breeding ecology in birds (Trivers, 1974; Price and Ydenberg, 1995; Schwagmeyer et al., 2008) such as parental trade-offs between the costs and benefits of investing resources in current versus future offspring (Stearns, 1992; Royle et al., 2004), and the factors that influence food allocation within a brood (Glassey and Forbes, 2002; García-Navas and Sanz, 2010). Analysis of movement patterns during food provisioning provides valuable insights into the efficiency of adults in delivering food to their chicks, the role of both sexes in brood food provisioning (Welcker et al., 2009), and parent-chick interactions (Svagelj, 2009; Svagelj and Quintana, 2011; Giudici et al., 2017). Classic methods for studying food provisioning in birds include direct behavioural observation and video recordings (Takahashi et al., 2003; Gladbach et al., 2009; Low et al., 2012). Although these methods have been widely used, they present limitations. For instance, they are inadequate for accurately quantifying fine-scale movements such as short and abrupt manoeuvres like head thrusts during food regurgitation or head and neck shakes of adults while provisioning their offspring. Moreover, manual video analysis is a tedious task and nearly impossible to scale up to large datasets (Brown et al., 2013; Sonerud et al., 2014).
The Imperial Shag (Leucocarbo atriceps) is a colonial seabird that inhabits the southern region of South America (Yorio et al., 1999). In this monogamous and biparental species, adults feed their chicks through regurgitation (Schreiber and Burger, 2001), and this behaviour is accompanied by distinctive head movements (Snow, 1963; Dunn, 1975; Giudici et al., 2017). It is reasonable to assume that the vigour of head movements associated with food provision varies with the phenological development of the chicks (Dunn, 1975; Olver, 1984; Goutner et al., 1997). The latter would be related to parents giving larger and less processed prey items to older chicks (Dunn, 1975). The aim of this study was to identify food provisioning behaviour in adult Imperial Shags feeding chicks of different age classes using tri-axial accelerometer data. To achieve this, we applied bimodal SVM models to the data and evaluated the performance of the models in discriminating between non-feeding and feeding events of chicks of three different age classes. We predicted that food provisioning events would be classified more accurately for the older than for the younger chicks. To our knowledge, this is the first study that explores the potential of accelerometry and machine learning to study food provisioning in birds.
2.
Materials and methods
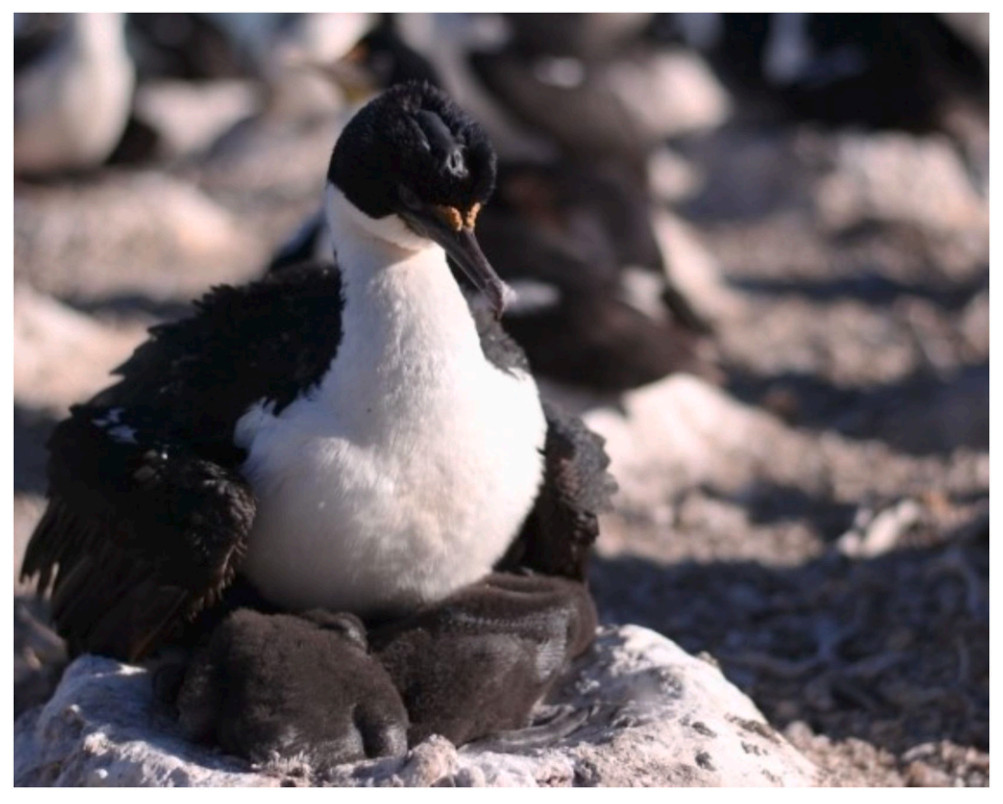
Fieldwork was conducted at Punta León Imperial Shag colony (43°04ʹ S, 64°29ʹ W), Chubut, Argentina, between mid-November and mid-December of 2019, 2021 and 2022. A total of 36 breeding females (14, 18 and 4 from 2019, 2021 and 2022, respectively) were instrumented with a tri-axial accelerometer (Technosmart, Rome, Italy, 50 mm in length, 8 mm in width, 3 mm in height, 2 g) on the head. The total weight of the device (i.e., 2 g) was less than 1% of the average adult female body mass (Svagelj and Quintana, 2007), being this percentage below the accepted recommendation of 3% (Kenward, 2001). Accelerometers were set to record data at 50 Hz in each of the three orthogonal axes: surge (AccX, anterior-posterior axis), sway (AccY, lateral axis), and heave (AccZ, dorso-ventral axis). In this study, we only assessed the provisioning behaviour of females, assuming that the movements involved in this behaviour are the same for both sexes. The reason why we worked with females only is that this sex feeds the chicks during the day (Harris et al., 2013), making it easier to video record the behaviours (see below). Adult females were distinguished from males by the vocalisations (males 'honk' and females 'hiss') (Malacalza and Hall, 1988; Svagelj and Quintana, 2007). Each female was gently removed from the nest using a specially designed hook to bring the animal closer to the handler without damaging the brood (see Gómez-Laich et al., 2022). Once close to the handler, the shag's neck was taken out of the crook by grasping the neck behind the head with one hand and using the second hand to gather the wings up against the body (Gómez-Laich et al., 2015). Accelerometers were attached to the feathers of the head using Tesa® tape, following Wilson et al. (1997) (Fig. 1), taking particular attention that the devices were placed in the same position on each animal. In all cases, the instrumentation procedure was completed in less than 5 min and birds were immediately returned to the nest. Since females leave the colony to forage early in the morning (see Harris et al., 2013), the instrumentations took place in the afternoon (5:00 p.m. approximately) on the day before the behavioural video recordings were performed (see below) and left on the birds for 24 h. All birds carrying devices returned to the colony and resumed normal nest attendance and breeding behaviour.
Figure
1.
Imperial Shag (Leucocarbo atriceps) equipped with a 2-g tri-axial accelerometer on the head using black Tesa® tape. Photo: Andrea Benvenuti.
During the first month of the chick-rearing period, breeding adults usually perform a single foraging trip per day with females foraging in the morning and males in the afternoon (Harris et al., 2013). Thus, before females returned from their foraging trip near midday, chicks from each brood were captured from the nest using a 1.5 m long wooden extension with a small basket/cup on its end. The age of each chick was estimated by measuring the tarsus with a digital caliper (nearest 0.01 mm) (Svagelj et al., 2019). To recognise each chick within a brood, nestlings were marked on the head and neck with nontoxic paint. Markings faded from chicks' feathers after 24 h (Giudici et al., 2017).
2.1
Video data analysis
To detect the acceleration signal associated with food provisioning by females, the first feeding session (i.e., started when the female began providing food to the nestlings and ended after 15 min of not delivering food to any of the chicks in the brood) from each instrumented bird was recorded by means of a video camera (Sony DCRSR88®). The cameras were placed between 2 and 3 m from the nest to avoid bird's disturbance.
The video recordings were analysed using Kinovea, a free video player software (Kinovea Creative Commons Attribution, 2006). A food provisioning event was defined as the interval from the time a chick was observed to place its head inside a female's mouth to obtain the regurgitated food until the time the chick took out its head from the female. The fed chicks were categorised into three age categories, according to the stage of their development (Svagelj et al., 2019). Category A chicks (less than or equal to 7 days old) belong to the slowest zone of the growth curve of this species, category B chicks (between 8 and 14 days old) were in the exponential phase of the curve, and category C chicks (between 15 and 21 days old) were in the phase where growth begins to slow down. All the activities performed by female birds while they were at the nest and not feeding their chicks were grouped into a single behavioural category called non-feeding.
2.2
Acceleration data analysis
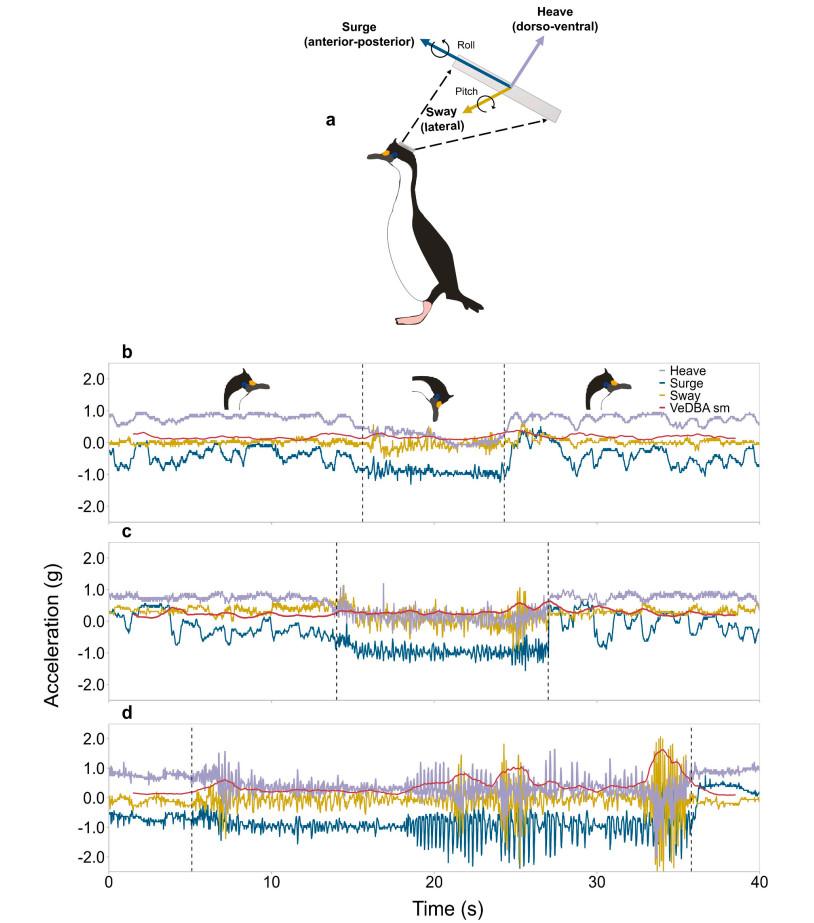
The acceleration data recorded by the devices consists of two components: the static component, which is dependent on gravity and describes the animal's posture, and the dynamic component, which reflects the movement of the body (Shepard et al., 2008; Wilson et al., 2008; Brown et al., 2013). These two components are measured in each of the three-dimensional axes (i.e., surge, sway and heave) (Fig. 2A). The static component of each acceleration axis was isolated by applying a running mean of 2 s following Shepard et al. (2008). The static component of each channel was used to compute the pitch and roll angles (i.e., rotational motion) and smoothed over 1 s applying the equations presented in Gunner et al. (2020). The dynamic component of each acceleration channel was calculated as the difference between raw and static acceleration. The dynamic component of each axis was used to compute the Vectorial Dynamic Body Acceleration (VeDBA) following Qasem et al. (2012). VeDBA values were smoothed over 1 s to eliminate individual strides (Wilson et al., 2019).
Figure
2.
Illustration showing how the heave, surge and sway acceleration measurements relate to the shag's head movements and how the pitch and roll angles relate to the shag's head angle (a). Example of the heave, surge and sway acceleration signals, and the smoothed VeDBA from the head of an Imperial Shag feeding a category A chick (less than or equal to seven days old) (b), feeding a category B chick (between eight and 14 days old) (c), and feeding a category C chick (between 15 and 21 days) (d). Illustrations of an adult head showing the head position during feeding (between dotted lines) and non-feeding of a chick are shown in panel b.
The mean, minimum, maximum, and standard deviation of the VeDBA, of the pitch and roll angles, and of the three raw and dynamic acceleration axes were computed using a sliding sample window of 1 s (equaling 50 samples of data), with a 0.98 s overlap (49 samples of data). This resulted in the calculation of 36 features (9 × 4).
To obtain a labelled data set, the acceleration data were matched to the behaviours previously identified from the videos using custom matching functions in the R version 4.1.1 (R Core Team, 2021).
2.3
Training and testing the Support Vector Machine
To identify food provisioning behaviour from accelerometry data, we used the SVM algorithm. Conceptually, the SMV algorithm aims to find a separating hyperplane that maximises the margin between two observational classes (Cortes and Vapnik, 1995). To find the hyperplane, the algorithm is based on a subset of training data points that are closest to it, known as support vectors (Kuhn and Johnson, 2013). As the distance formula employed in the SVM method is highly dependent on the scale of the variables (Lantz, 2019), acceleration features were rescaled using the min-max normalisation. We implemented a binary SVM using the R package "e1071" (Meyer et al., 2017) setting the kernel type to "linear" and a cost value of 1. We ran three SVMs, one for each chick category. For each model, we randomly divided the individuals with segmented and annotated data into a training data set (70% of the individuals) and a testing data set (30% of the individuals). If the instrumented adult had fed chicks from different age categories (e.g., nests containing chicks between six and 10 days old), we incorporated each provisioning behaviour into the corresponding model. The training data set was used to train and validate the model by performing Leave-One-Individual-Out-cross-validation (LOIO) (Chakravarty et al., 2019), which ensures to account for variability among individuals. LOIO consisted of training the model using the pooled data of all individuals except one and then validating this model on data from the individual left out (Chakravarty et al., 2019). This process was repeated until each individual was used for validation. For each iteration, the training data set was balanced by randomly selecting similar proportions of feeding and non-feeding behaviours across individuals, while the validation dataset (i.e., from the animal left out) was not balanced. Afterwards, we applied a time filter based on the minimum duration of a food transfer event for each chick's age category, these being: 2 s for categories A and B and 3 s for category C. Finally, we used the confusionMatrix from the R package "caret" to summarise the models' performance before and after the application of the time filter. These matrices enabled us to determine, for each validation individual, the proportion of True Positives (VP), False Positives (FP), True Negatives (TN), or False Negatives (FN). The confusion matrices obtained from each validation individual (before and after the filter was applied) were then combined to produce aggregate confusion matrices from which the mean of the following performance statistics was calculated: overall accuracy, sensitivity, and precision.
Finally, to evaluate the performance of the final model, we employed the testing data for each chick category set. From the results of the LOIO, we randomly chose one model for each of the three chick categories. These selected models were then utilised to classify the respective testing data sets. The classification process was carried out using the "predict" function from the R package "e1071". Afterwards, we applied the time filter to each chick category and compared the success of the predictions before and after adding the filter using confusion matrices.
3.
Results
3.1
Head acceleration patterns
A total of 359 food provisioning events were identified during 17 h of video recording. Of these, 86 (24%) corresponded to category A chicks, 166 (46%) to category B chicks and 107 (30%) to category C chicks. The duration of food provisioning events varied between chick age categories. For category A chicks, the mean duration of food provisioning events was 12.5 ± 7.7 s (range: 2–58 s), while for category B chicks the mean duration of food provisioning events was 14.6 ± 10.1 s (range: 2–63 s) and for category C chicks 18.4 ± 11.7 s (range: 3–70 s). Food provisioning by adult females showed a distinct pattern of head movements in the three acceleration axes, with greater oscillations in the three axes when feeding older chicks (Fig. 2b, c and d). During food provisioning, anterior-posterior head movements exhibited a cyclical pattern with values fluctuating around −1 g when females fed chicks of less than 2 weeks old (Fig. 2b and c), and with values fluctuating between −1 g and −2 g when feeding chicks older than 14 days (Fig. 2d). Adults' head movements along the dorso-ventral axis were similar when feeding chicks of the three different age categories, with values oscillating around 0.5 g and reaching values of −2 g when feeding category C chicks (Fig. 2b, c and d). When feeding category A and B chicks, the lateral head movements of adults did not show much variation and were characterised by values around 0 g. However, when feeding older chicks, the head movements of females showed greater oscillations in the lateral acceleration profile, with clear peaks between 2 g and −2 g (Fig. 2b, c and d). A greater effort or intensity in the provisioning movements, as indicated by the smooth VeDBA values, was observed in older chicks (Fig. 2). For younger chicks (categories A and B), the smooth VeDBA values oscillated around 0.5 g (Fig. 2b and c), whereas for the older chicks (category C) the smooth VeDBA values were considerably higher, averaging around 1.5 g (Fig. 2d).
3.2
SVM performance
Almost five million data points were used to run the models for all chick categories (Table 1) and more than 88% of the data points were correctly classified (overall accuracy values above 88%; Table 2) when the time filter was not applied. The highest sensitivity was found for the category B chicks' model (i.e., how often a food provisioning event was correctly identified), followed by the category C and A chicks' models (96, 91 and 88%, respectively) (Table 2). For the three chick age categories, model precision values (i.e., how often the model was right when predicting food provisioning behaviour) were relatively low (< 56%), with this metric performing better for category C chicks (Table 2, see Appendix Tables S2–S3 for the results of LOIO per individual and the aggregate confusion matrices).
Table
1.
Number of data points of each behaviour class used to run LOIO cross-validation.
Table
2.
Results of the LOIO cross-validations without applying (SVM) and applying the filter (SVM + filter) based on the minimum duration of a food provisioning event for each of the three chick categories (i.e., A, B and C). Performance metrics were calculated separately for each validation individual. The mean and standard deviation across validation individuals are shown. Overall Accuracy (Ove. Acc.); Sensitivity (Sen.) and Precision (Prec.).
After the application of the time filter, the performance of the three models improved, in particular by reducing the number of false food provisioning behaviours (i.e., false positives, see Appendix Table S4). Under these conditions, the model for category C chicks showed the highest overall classification accuracy (95%), followed by the category B chicks' model (almost 95%) and the category A chick's model (almost 91%) (Table 2). The category B chicks model performed better than the category A and C models in terms of sensitivity (Table 2). Category C model showed the highest precision value (72.4%) (Table 2, see Appendix Tables S4–S5 for the results of LOIO per individual and the aggregate confusion matrices).
The predicted behaviours of each of the test data sets (one for each chick category, see Appendix Table S6) achieved high overall accuracies ranging from 90 to 97% (Table 3). For age categories A and B chicks, the application of the time filter improved the precision of the models (Table 3). However, for category C chicks, the application of the time filter resulted in a lower sensitivity (Table 3). High inter-individual variation was observed in the precision and sensitivity values of the individuals from the B and C chick categories (Table 3, see Appendix Tables S7–S10).
Table
3.
Performance of the final selected models without applying a filter (SVM) and applying the filter (SVM + filter) based on the minimum duration of a food provisioning event for each of the three chick categories. Performance metrics were calculated separately for each test individual. The mean and standard deviation across test individuals are shown. Overall Accuracy (Ove. Acc.); Sensitivity (Sen.) and Precision (Prec.).
In this study, we demonstrate the utility of accelerometer data in the identification of food provisioning behaviour exhibited by avian species. Analysis of head acceleration profiles of 36 adult female Imperial Shags during food provisioning events revealed a distinct pattern characterised by negative values on the surge acceleration axis as a product of the downward tilt of the head during this behaviour. The recorded rapid oscillations detected along both the surge and lateral axes, conform to the anterior-posterior and lateral displacements typical of regurgitation events. These movements are commonly accompanied by vigorous head shaking to facilitate the release of stored food from the gular pouch to feed the chicks (Nelson, 2006). The application of SVM models across varying chick-age categories demonstrated a significant positive association between model predictive efficacy and chick age. This trend is likely attributed to escalating movement vigour inherent in food provisioning behaviour as chicks progress through developmental stages. Adults feed older chicks with larger and less processed prey items (i.e., whole fish as opposed to the semi-liquid food that is provided to juveniles), which are transferred with more vigorous movements (Olver, 1984; Goutner et al., 1997).
Our study shows indicate promising prospects concerning the efficacy of the models in discerning feed and non-feed events. This is supported by the high overall accuracy values (> 90%), indicating the algorithms' ability to accurately predict most instances. Although this metric is important and provides a clear measure of model performance, it is also necessary to consider the other, more specific metrics. Previous research (Carroll et al., 2014) has highlighted the significance of evaluating model performance in predicting the target class (i.e., precision) when using a SVM model to solve a binary classification problem. In our case study, precision was consistently the poorest metric. The observed phenomenon stemmed from a predisposition of the three models towards overestimating occurrences of food provisioning events. Despite the implementation of a time filter yielding an enhancement in the metric's efficacy by mitigating instances of false positives or erroneous alarms across all three models, the attained values consistently remained below 73%. Low precision values could be attributed to the fact that while at the nest, adults engage in numerous fine-scale head movements. From an accelerometry perspective, these movements are similar to the motions associated with provisioning the chicks. For example, adults frequently arrange nest material (i.e., branches and/or seaweed brought by their partner), accommodate chicks, and groom their partner or themselves (Olver, 1984; Schreiber and Burger, 2001). In other words, the non-feeding behaviour category probably included movements where the acceleration pattern was very similar to that of food provisioning events, leading to the misclassification of behaviours mostly when feeding chicks less than one week old. Previous studies in other avian species such as the Golden Eagle (Aquila chrysaetos) have also shown low levels of precision for behaviours that are either complex or varied (Sur et al., 2017). Future studies, or further exploration of this dataset, should include more behavioural categories to distinguish food provisioning events with greater certainty. Enhancing the accuracy of identifying feeding events can also be achieved by concurrently instrumenting adult birds offering food and chicks exhibiting begging behaviour. Detecting chick begging behaviour of a chick prior to a feeding event would increase the reliability of the identified food provisioning event (by integrating chick and adult acceleration information to train a single model that can determine that an adult provisioning event must be preceded by chick begging). Hidden Markov Models (HMMs) may provide a viable solution for assessing these issues, as they effectively account for the dependency between current and past behaviours (Schafer et al., 2020). However, it should be noted that instrumentations of adults and chicks requires more effort, more devices to be used simultaneously and a greater amount of data to be analysed.
The use of the accelerometry technique to determine food provisioning behaviour offers at least four key advantages over traditional methods. Firstly, it allows a greater number of animals to be studied simultaneously. Secondly, it can be used to document food provisioning behaviour continuously over longer time periods, ranging from days to weeks depending on the programmed schedule and battery used. It is also independent of the position of the observer relative to the monitored individual, overcoming the limitations imposed by visual observations or video recordings when the individual of interest is out of sight. For instance, behavioural detection is frequently impeded when chicks are oriented away from the camera or observer, when the focal adult rotates, or when other nearby animals obstruct the view of the observed individual. In addition, as accelerometers can be attached to adults for several hours or even days, they can record the at sea foraging effort. Integrating information on foraging behaviour with that on food provisioning would provide new insights into how the effort each member of the pair makes at sea to get food is reflected in the amount of food they deliver to the chicks and in how they distribute it among siblings. Furthermore, our findings will play a pivotal role in elucidating theoretical concepts concerning sex-specific roles in food provisioning, the allocation of food by parents as a mechanism for brood reduction, and the accurate investigation of food transfer from parents to chicks.
Ethics statement
All handling procedures were approved by the Dirección de Fauna y Flora Silvestre (permit 101/22-DFyFS), the Ministerio de Turismo y Áreas Protegidas of the Province of Chubut (permits: 47/19 and 63/21-SsCyAP) and the Comité Institucional para el Uso de Animales de Experimentación (CICUAE CCT CENPAT CONICET) (resolution 6/2021).
The authors declare that they have no known competing financial interests or personal relationships that could have appeared to influence the work reported in this paper.
Acknowledgements
We would like to express our gratitude to La Chola, Miguel and Estancia El Pedral for their assistance in various aspects of this research, and Andrea Benvenuti for his contribution during fieldwork. Additionally, we would like to thank the Instituto de Biología de Organismos Marinos (IBIOMAR-CONICET) for institutional and logistical support.
Bidder, O.R., di Virgilio, A., Hunter, J.S., McInturff, A., Gaynor, K.M., Smith, A.M., et al., 2020. Monitoring canid scent marking in space and time using a biologging and machine learning approach. Sci. Rep. 10, 588.
Brown, D.D., Kays, R., Wikelski, M., Wilson, R., Klimley, A.P., 2013. Observing the unwatchable through acceleration logging of animal behavior. Anim. Biotelemetry 1, 20.
Campera, M., Chimienti, M., Nekaris, K.A.I., 2023. Applications of accelerometers and other bio-logging devices in captive and wild animals. Animals 13, 222. .
Carroll, G., Slip, D., Jonsen, I., Harcourt, R., 2014. Supervised accelerometry analysis can identify prey capture by penguins at sea. J. Exp. Biol. 24, 4295–4302.
Chakravarty, P., Cozzi, G., Ozgul, A., Aminian, K., 2019. A novel biomechanical approach for animal behaviour recognition using accelerometers. Methods Ecol. Evol. 10, 802–814.
Chimienti, M., Kato, A., Hicks, O., Angelier, F., Beaulieu, M., Ouled-Cheikh, J., et al., 2022. The role of individual variability on the predictive performance of machine learning applied to large bio-logging datasets. Sci. Rep. 12, 19737.
Dean, B., Freeman, R., Kirk, H., Leonard, K., Phillips, R.A., Perrins, C.M., et al., 2013. Behavioural mapping of a pelagic seabird: combining multiple sensors and a hidden Markov model reveals the distribution of at-sea behaviour. J. R. Soc., Interface 10, 20120570.
Del Caño, M., Quintana, F., Yoda, K., Dell'Omo, G., Blanco, G.S., Gómez-Laich, A., 2021. Fine-scale body and head movements allow to determine prey capture events in the Magellanic Penguin (Spheniscus magellanicus). Mar. Biol. 168, 84.
Dunn, E.H., 1975. Caloric intake of nestling double-crested cormorants. Auk 92, 553–565.
García-Navas, V., Sanz, J.J., 2010. Flexibility in the foraging behavior of blue tits in response to short-term manipulations of brood size. Ethology 116, 744–754.
Giudici, P.I., Quintana, F., Svagelj, W.S., 2017. The role of hatching asynchrony in a seabird species exhibiting obligate brood reduction. Waterbirds 40, 221–232.
Gladbach, A., Braun, C., Nordt, A., Peter, H.U., Quillfeldt, P., 2009. Chick provisioning and nest attendance of male and female Wilson's storm petrels Oceanites oceanicus. Polar Biol. 32, 1315–1321.
Glassey, B., Forbes, S., 2002. Begging and asymmetric nestling competition. In: Wright, J., Leonard, M.L. (Eds.), The Evolution of Begging: Competition, Cooperation and Communication. Springer, Dordrecht, pp. 269–281.
Gómez-Laich, A., Pantano, C., Wilson, R.P., Svagelj, W.S., Yoda, K., Gunner, R., et al., 2022. Leg rings impact the diving performance of a foot-propelled diver. Ibis 164, 118–131.
Gómez-Laich, A., Wilson, R.P., Shepard, E.L., Quintana, F., 2013. Energy expenditure and food consumption of foraging Imperial cormorants in Patagonia, Argentina. Mar. Biol. 160, 1697–1707.
Gómez-Laich, A., Yoda, K., Zavalaga, C., Quintana, F., 2015. Selfies of imperial cormorants (Phalacrocorax atriceps): what is happening underwater? PLoS One 10, e0136980.
Gómez-Laich, A.G., Wilson, R.P., Gleiss, A.C., Shepard, E.L., Quintana, F., 2011. Use of overall dynamic body acceleration for estimating energy expenditure in cormorants: does locomotion in different media affect relationships? J. Exp. Mar. Biol. Ecol. 399, 151–155.
Goutner, V., Papakostas, G., Economidis, P.S., 1997. Diet and growth of great cormorant (Phalacrocorax carbo) nestlings in a Mediterranean estuarine environment (Axios Delta, Greece). Isr. J. Ecol. Evol. 43, 133–148.
Gunner, R.M., Wilson, R.P., Holton, M.D., Scott, R., Hopkins, P., Duarte, C.M., 2020. A new direction for differentiating animal activity based on measuring angular velocity about the yaw axis. Ecol. Evol. 10, 7872–7886.
Harris, S., Raya Rey, A., Phillips, R.A., Quintana, F., 2013. Sexual segregation in timing of foraging by imperial shags (Phalacrocorax atriceps): is it always ladies first? Mar. Biol. 160, 1249–1258.
Hathaway, A., Campera, M., Hedger, K., Chimienti, M., Adinda, E., Ahmad, N., et al., 2023. Analysis of accelerometer data using random forest models to classify the behavior of a wild nocturnal primate: Javan Slow Loris (Nycticebus javanicus). Ecologie (Brunoy) 4, 636–653.
Kenward, R.E., 2001. A Manual for Wildlife Radio Tagging. Academic Press, London.
Kinovea Creative Commons Attribution, 2006. Kinovea v. 0.8.15 for windows. Kinovea Paris France. . (Accessed 10 March 2014).
Kuhn, M., Johnson, K., 2013. Applied Predictive Modelling, vol. 26. Springer, New York.
Lantz, B., 2019. Machine Learning with R: Expert Techniques for Predictive Modelling. Packt Publishing Ltd.
Low, M., Makan, T., Castro, I., 2012. Food availability and offspring demand influence sex-specific patterns and repeatability of parental provisioning. Behav. Ecol. 23, 25–34.
Malacalza, V.E., Hall, M.A., 1988. Sexing adult King Cormorants (Phalacrocorax albiventer) by discriminant analysis. Colon. Waterbirds 11, 32–37.
Martiskainen, P., Järvinen, M., Skön, J.P., Tiirikainen, J., Kolehmainen, M., Mononen, J., 2009. Cow behaviour pattern recognition using a three-dimensional accelerometer and support vector machines. Appl. Anim. Behav. Sci. 119, 32–38.
Meyer, D., Dimitriadou, E., Hornik, K., Weingnessel, A., Leisch, F., 2017. e1071: Misc Functions of the Department of Statistics, Probability Theory Group (Formerly: E1071). R Package version 1.6-8. 1, 2. .
Nathan, R., Monk, C.T., Arlinghaus, R., Adam, T., Alós, J., Assaf, M., et al., 2022. Big-data approaches lead to an increased understanding of the ecology of animal movement. Science 375, eabg1780.
Nathan, R., Spiegel, O., Fortmann-Roe, S., Harel, R., Wikelski, M., Getz, W.M., 2012. Using tri-axial acceleration data to identify behavioral modes of free-ranging animals: general concepts and tools illustrated for griffon vultures. J. Exp. Biol. 215, 986–996.
Nelson, J.B., 2006. Pelicans, Cormorants, and Their Relatives: Pelecanidae, Sulidae, Phalacrocoracidae, Anhingidae, Fregatidae, Phaethontidae. Oxford University Press, Oxford.
Olver, M.D., 1984. Breeding biology of the reed cormorant. Ostrich 55, 133–140.
Price, K., Ydenberg, R., 1995. Begging and provisioning in broods of asynchronously-hatched yellow-headed blackbird nestlings. Behav. Ecol. Sociobiol. 37, 201–208.
Qasem, L., Cardew, A., Wilson, A., Griffiths, I., Halsey, L.G., Shepard, E.L., et al., 2012. Tri-axial dynamic acceleration as a proxy for animal energy expenditure; should we be summing values or calculating the vector? PLoS One 7, e31187.
R Core Team, 2021. R: a Language and Environment for Statistical Computing. R Foundation for Statistical Computing, Vienna. .
Royle, N.J., Hartley, I.R., Parker, G.A., 2004. Parental investment and family dynamics: interactions between theory and empirical tests. Popul. Ecol. 46, 231–241.
Schafer, T.L., Wikle, C.K., VonBank, J.A., Ballard, B.M., Weegman, M.D., 2020. A Bayesian Markov model with Pólya-Gamma sampling for estimating individual behavior transition probabilities from accelerometer classifications. J. Agric. Biol. Environ. Stat. 25, 365–382.
Shepard, E.L., Wilson, R.P., Quintana, F., Laich, A.G., Liebsch, N., Albareda, D.A., et al., 2008. Identification of animal movement patterns using tri-axial accelerometry. Endanger. Species Res. 10, 47–60.
Snow, B.K., 1963. The behaviour of the shag. Br. Birds 56, 77–103.
Sonerud, G.A., Steen, R., Selås, V., Aanonsen, O.M., Aasen, G.H., Fagerland, K.L., et al., 2014. Evolution of parental roles in provisioning birds: diet determines role asymmetry in raptors. Behav. Ecol. 25, 762–772.
Stearns, S.C., 1992. The Evolution of Life Histories. Oxford University Press, Oxford.
Sur, M., Suffredini, T., Wessells, S.M., Bloom, P.H., Lanzone, M., Blackshire, S., et al., 2017. Improved supervised classification of accelerometry data to distinguish behaviors of soaring birds. PLoS One 12, e0174785.
Sutton, G.J., Bost, C.A., Kouzani, A.Z., Adams, S.D., Mitchell, K., Arnould, J.P.Y., 2021. Fine-scale foraging effort and efficiency of Macaroni penguins is influenced by prey type, patch density and temporal dynamics. Mar. Biol. (N. Y.) 168, 3.
Svagelj, W.S., Quintana, F., 2007. Sexual size dimorphism and sex determination by morphometric measurements in breeding Imperial Shags (Phalacrocorax atriceps). Waterbirds 30, 97–102.
Svagelj, S.W., 2009. Breeding Ecology of Dimorphic Seabirds in Relation to Parental Investment and Brood Sex Ratio Theories. Ph. D Thesis. University of Buenos Aires, Argentina.
Svagelj, W.S., Quintana, F., 2011. Breeding performance of the Imperial Shag (Phalacrocorax atriceps) in relation to year, laying date and nest location. Emu 111, 162–165.
Svagelj, W.S., Gómez-Laich, A., Quintana, F., 2019. Richards's equation and nonlinear mixed models applied to avian growth: why use them? J. Avian Biol. 50, e01864. https://doi: .
Takahashi, A., Watanuki, Y., Sato, K., Kato, A., Arai, N., Nishikawa, J., et al., 2003. Parental foraging effort and offspring growth in Adélie penguins: does working hard improve reproductive success? Funct. Ecol. 590–597.
Watanabe, Y.Y., Papastamatiou, Y.P., 2023. Biologging and biotelemetry: tools for understanding the lives and environments of marine animals. Annu. Rev. Anim. Biosci. 11, 247–267.
Watanabe, Y.Y., Takahashi, A., Sato, K., Viviant, M., Bost, C.A., 2011. Poor flight performance in deep-diving cormorants. J. Exp. Biol. 214, 412–421.
Welcker, J., Steen, H., Harding, A.M., Gabrielsen, G.W., 2009. Sex-specific provisioning behaviour in a monomorphic seabird with a bimodal foraging strategy. Ibis 151, 502–513.
Williams, H.J., Shepard, E.L., Duriez, O., Lambertucci, S.A., 2015. Can accelerometry be used to distinguish between flight types in soaring birds? Anim. Biotelem. 3, 45.
Wilson, R.P., Börger, L., Holton, M.D., Scantlebury, D.M., Gómez-Laich, A., Quintana, F., et al., 2019. Estimates for energy expenditure in free-living animals using acceleration proxies: a reappraisal. J. Anim. Ecol. 89, 161–172.
Wilson, R.P., Pütz, K., Peters, G., Culik, B., Scolaro, J.A., Charrassin, J.B., et al., 1997. Long-term attachment of transmitting and recording devices to penguins and other seabirds. Wildl. Soc. Bull. 25, 101–106.
Wilson, R.P., Shepard, E.L., Liebsch, N., 2008. Prying into the intimate details of animal lives: use of a daily diary on animals. Endanger. Species Res. 4, 123–137.
Yorio, P., Frere, E., Gandini, P., Conway, W., 1999. Status and conservation of seabirds breeding in Argentina. Bird. Conserv. Int. 9, 299–314.
Table
2.
Results of the LOIO cross-validations without applying (SVM) and applying the filter (SVM + filter) based on the minimum duration of a food provisioning event for each of the three chick categories (i.e., A, B and C). Performance metrics were calculated separately for each validation individual. The mean and standard deviation across validation individuals are shown. Overall Accuracy (Ove. Acc.); Sensitivity (Sen.) and Precision (Prec.).
Table
3.
Performance of the final selected models without applying a filter (SVM) and applying the filter (SVM + filter) based on the minimum duration of a food provisioning event for each of the three chick categories. Performance metrics were calculated separately for each test individual. The mean and standard deviation across test individuals are shown. Overall Accuracy (Ove. Acc.); Sensitivity (Sen.) and Precision (Prec.).

 DownLoad:


 Email Alerts
 RSS Feeds