Qing Zeng, Qian Wei, Guangchun Lei. 2018: Contribution of citizen science towards cryptic species census: "many eyes" define wintering range of the Scaly-sided Merganser in mainland China. Avian Research, 9(1): 6. DOI: 10.1186/s40657-018-0098-5
Citation:
Qing Zeng, Qian Wei, Guangchun Lei. 2018: Contribution of citizen science towards cryptic species census: "many eyes" define wintering range of the Scaly-sided Merganser in mainland China. Avian Research, 9(1): 6. DOI: 10.1186/s40657-018-0098-5
Qing Zeng, Qian Wei, Guangchun Lei. 2018: Contribution of citizen science towards cryptic species census: "many eyes" define wintering range of the Scaly-sided Merganser in mainland China. Avian Research, 9(1): 6. DOI: 10.1186/s40657-018-0098-5
Citation:
Qing Zeng, Qian Wei, Guangchun Lei. 2018: Contribution of citizen science towards cryptic species census: "many eyes" define wintering range of the Scaly-sided Merganser in mainland China. Avian Research, 9(1): 6. DOI: 10.1186/s40657-018-0098-5
Citizen science has tremendous potential in advancing scientific knowledge and improving natural resource management. To detect the wintering distribution of the endangered species Scaly-sided Merganser (Mergus squamatus), national wintering surveys were organized by China Birdwatching Association.
Methods
The surveys of M. squamatus were conducted in three successive winters from 2014 to 2016. A total of 2019 people from 102 organizations participated in the surveys. With three groups of 13 environmental variables, species distribution model for its wintering distribution of each year was developed using random forest. Schoener's D index was used to compare the distribution of M. squamatus in 3 years.
Results
Totally, 441, 634 and 1138 individuals of M. squamatus were recorded in 2014, 2015 and 2016 respectively. Two main sites in Dabie Mountain and East Qinling mountains were verified and the wintering range of M. squamatus was defined. The wintering range was found to be highly identical for the 3 years.
Conclusions
The highly overlapped distribution range among years suggested that the wintering range of M. squamatus was relatively stable. Well organized and coordinated citizen science can be used to define distribution range and improve species conservation.
Achieving accurate biological patterns across broad spatial extents requires novel approaches for acquiring, integrating, and analyzing diverse observational data at large scales (Wood et al. 2011). Citizen science has been remarkably successful in advancing scientific knowledge (Bonney et al. 2009), improving natural resources management and environmental protection through informing policymaking and fostering public input and engagement (McKinley et al. 2017). Citizen science projects covered a breadth of topics. Citizen-based contributions to mainstream scientific investigations are becoming increasingly important. For instances, searching for a ladybug species thought to have gone extinct (Losey et al. 2007), examining the distribution change of bird species over time and space (Bonter and Harvey 2008), and detecting the arrival and distribution of invasive plant species (Bois et al. 2011). Most citizen science schemes are found in Europe, North America, South Africa, India, and Australia (Chandler et al. 2017), while it started development in China through birdwatching societies and activities, and has contributed to a greater understanding of the population status of birds (Ma et al. 2013; Hu et al. 2017). However, the majority of birdwatching records were provided by individuals in an uncoordinated way, preventing to achieve the full potential of public participation in bird conservation. An organization that integrates and standardizes these local efforts would be advantageous and desirable. Given this, the China Birdwatching Association (CBA) was launched in July 2014 aiming to connect all the bird watching societies in China in a network, and to facilitate the sharing of experience, birding information, education material and conservation news within the community.
As one of the highlight programs, CBA organized the National Wintering Survey of Scaly-sided Merganser (Mergus squamatus) for successive three winters (2014, 2015 and 2016). The Scaly-sided Merganser, also called Chinese Merganser, is an endemic species restricted to east Asia. It is listed as endangered worldwide (IUCN 2017). In China, M. squamatus is listed as a first-class key protected wild animal. The species is of great conservation concern as it is suspected to be undergoing a continuing and rapid decline due to dam construction, illegal hunting and logging (EAAFP 2015). Furthermore, it is designated as flagship species for freshwater biodiversity conservation and represents a key indicator for assessing wetland ecosystem quality (Zeng et al. 2017). M. squamatus breeds in southeast Russia and northeast China. The entire population is estimated to be around 4660 individuals based on the breeding survey (Solovyeva et al. 2014). However, the total number of wintering birds counted (c. 400) on rivers and fresh water bodies in southern and central China is only a small portion of the total population. The ten-fold gap between breeding and wintering populations revealed that the location of majority of the wintering population is unknown (Barter et al. 2014; Solovyeva et al. 2014), representing a major conservation predicament for this endangered species. However, there are several obstacles for conventional scientific study to accurately define its wintering range. First, the species is widely dispersed in rivers, lakes and reservoirs of central and southern China, with small numbers in Japan, Korean peninsula, and southeast Asia (IUCN 2017), requiring large manpower for a systematic survey. Second, this duck is shy and easily startled (Zeng et al. 2015a), making it hard to be located. Third, the birds are not very social, and flocks of more than 10 are very rare (He et al. 2006). Citizen science, with its "many eyes", could be an effective way (Dickinson et al. 2012) to find and locate this cryptic and rare diving duck. The three national-scale campaigns might collect sufficient data and information to advance the scientific understanding in its ecology, and to improve its conservation and management (Wood et al. 2011). This study explored these potentials.
In this paper, we summarized and reported on the 3-year national surveys. The main objective of the study was to use citizen science to infer the wintering range of M. squamatus and the overlap and shift of its distribution area, which could be strategically applied to improve our understanding of spatial and temporal distributions of waterbirds.
Methods
National survey
A total of 2019 people took part in the surveys. Most of the participants were from 102 bird watching societies, universities and institutes, or relevant organizations with basic background of field work and bird watching. All volunteer observers were trained to identify M. squamatus, especially from Common Merganser (M. merganser) or Red-breasted Merganser (M. serrator). The connection of ecological process is used to define "site", e.g., a river section between two dams, or a reservoir with closed boundary. In the first year, the sites were based on historical distribution, and stretched to adjacent river sections or reservoirs, with consideration of site condition (hydrology, land cover, anthropogenic disturbance, etc.) during the survey. In the following years, surveyed sites were improved according to the last year's situation.
The National Wintering Survey of M. squamatus was conducted during the weekends in late December to early January when the wintering population of the duck is mostly stable (Zeng et al. 2015a). Effective monitoring requires that data collection ensures a relatively high probability of detecting the target species (e.g. Conway 2011). Considering the weather conditions and available time of volunteer observers, a strict synchronous survey at national scale is quite difficult due to large numbers of participants and geographic range. Each group could confirm their preferred survey date based on a suggested time periods. All field surveys were conducted on clear days, avoiding snowy, rainy, or strong windy days. Each team was comprised of at least three observers, who walked along the river or travelled by car/boat, and used binoculars to identify and locate M. squamatus. A GPS receiver was used to record the location and as the GPS logged coordinates corresponding to the location of the observers, not the actual position of the ducks, we used GoogleEarth to plot the precise coordinates. The ducks resting on land or foraging in water were also recorded. To avoid repeat counting, only birds flying from one direction (upper or lower reach) were counted. A photo of the species as well as the habitat ensured quality control and review of the data. Although the surveys were designed to target the Scaly-sided Merganser, observers were encouraged to record detections of other species. Supplementary information including disturbance (e.g., number of boats that use the river section during the count period), and other relevant data from volunteers and local people were also collected during the survey.
A datasheet was used with a unified format, including basic information that identifies the observer and describes how the count was conducted (start time, duration, and distance traveled), and information of birds (number, sex ratio, location, behavior), habitats (wetland types, bottom types, water depth, speed) and anthropogenic influence (disturbance, river regulation projects). Each team was required to complete the paper form in the field and input data later into an Excel sheet. The paper datasheet, the e-form, and field photo were all submitted to CBA. Observers were encouraged to enter their data into the pooled web-based biodiversity citizen science database (http://www.birdreport.cn). These data are collected and organized with the same protocol, and reviewed and confirmed by experts aided by field photos provided by volunteers.
Environmental variables
Although many routes meander over 20 km, centroid of each route path was used to characterize site for the geographic analyses (Flather and Sauer 1996; Sauer et al. 2013).
We used three groups of 13 environmental variables (Table 1) to model the wintering distribution of M. squamatus. Group one variables, which were derived from stream network and Digital Elevation Model (DEM), are related to hydrogeomorphology. Group two variables describe human disturbances, including dam density, distance to the nearest town, distance to roads, distance to railways, and distance to the nearest protected areas. Group three variables were derived from Normalized Difference Vegetation Index (NDVI) as proxies for site productivity. The 1 km STRM30 DEM dataset was downloaded from http://srtm.csi.cgiar.org/ (retrieved on 21 July 2017); land cover was obtained from Global Land Cover database (Friedl et al. 2002); river polylines were retrieved from HydroSHEDS dataset (http://hydrosheds.cr.usgs.gov, retrieved on 21 July 2017); and NDVI for 2014, 2015 and 2016 data were obtained from the U.S. Geological Survey (USGS) Earth Resources Observation and Science Center (EROS http://LPDAAC.usgs.gov, retrieved on 24 July 2017). Protected areas shapefile was obtained from World Database on Protected Areas (WDPA, retrieved on 20 July 2017 from: http://www.protectedplanet.net).
Table
1.
Environmental variables used in models
Category
Variable
Description
Hydrogeomorphic
Ele_COV
Coefficient of variation of elevation within a 1 km x 1 km window
DEM
Mean elevation within a 1 km x 1 km window
Dist_w
Distance to waterbodies (larger than 1 km2) weighted by DEM
Dist_rv
Distance to river weighted by DEM
RvDen
River density
Human disturbance
Dist_nat
Distance to protected areas weighted by DEM
Dist_rd
Distance to roads weighted by DEM
Dist_town
Distance to settlement weighted by DEM
DamDEN
Dam density
Land productivity
COV
Coefficient of variation of monthly NDVI in a year, i.e. NDVI seasonality
NDVI.Max
Maximum NDVI in a year
NDVI.Mean
Mean monthly NDVI in a year
NDVI.Min
Minimum NDVI in a year
Hydrogeomorphic and human disturbance variables were scaled so that the values were between 0 and 1
We first transformed the survey data into presence/absence. For each year, we developed a species distribution model (SDM) for the wintering distribution of M. squamatus using random forest. Random forest is one of most commonly used machine learning techniques in classification (Oliveira et al. 2012). Several features make random forest useful for our study. First, random forest is a non-parametric rule-based algorithm, which generally performs better than parametric methods for complex systems (Breiman 2001). Second, it can handle both nonlinearity and interactions among predictors better than generalized linear and generalized additive modelling (Oliveira et al. 2012). Furthermore, the algorithm estimates the importance of a variable by looking at how much prediction error increases when out-of-bag data for that variable is permuted while all others are left unchanged (Grömping 2009), which is very helpful to investigate the most important environmental variables in determining the presence of M. squamatus for better conservation. For each SDM, we used randomly selected 85% of data points for model building and the rest for model validation. We reported three accuracy measures to evaluate predictive performance, including the area under the receiver operating characteristic (AUC), proportion correctly identified, and Kappa (VanDerWal et al. 2014).
Using the trained random forest models, we predicted the wintering distribution of M. squamatus for 2014, 2015 and 2016. We also produced a maximum distribution range by summing up the three SDMs. The maximum distribution represents all the potentially suitable wintering habitats in mainland China.
Multicollinearity of the predictor variables can not only affect the overall performance but also the estimates of variable importance in random forest models (Siroky 2009). To limit the impacts of multicollinearity, NDVI.Max and NDVI.Mean were excluded from model fitting as they were highly correlated with NDVI.Min (Pearson's correlation coefficient equals to 0.78 and 0.93 for NDVI.Max and NDVI.Min, respectively).
Distribution overlap and shift
We compared the distribution of M. squamatus in 3 years (i.e. 2014, 2015 and 2016) using Schoener's D index (Schoener 1968). Schoener's D index is a classical and reliable measure of niche overlap (Rödder and Engler 2011) widely used in ecological studies, particularly for SDM applications (Wen et al. 2015). Schoener's D index ranges from 0 (distribution models have no overlap) to 1 (distribution models are identical) and are derived from the difference in probability distributions over space produced between two SDMs.
We used R 3.3.2 (R Development Core Team 2016) for all statistical analyses. We used the package randomForest 4.6-12 (Liaw and Wiener 2002) for distribution modelling; the package SDMTools 1.1-221 (VanDerWal et al. 2014) for model evaluation; the package dismo 0.9-3 (Hijmans et al. 2015) for niche similarity statistic to quantifying distribution overlaps and shifts; and raster 2.1-25 (Hijmans and Van Etten 2014) for grid data transforming, preparing and visualization.
Results
National wintering survey
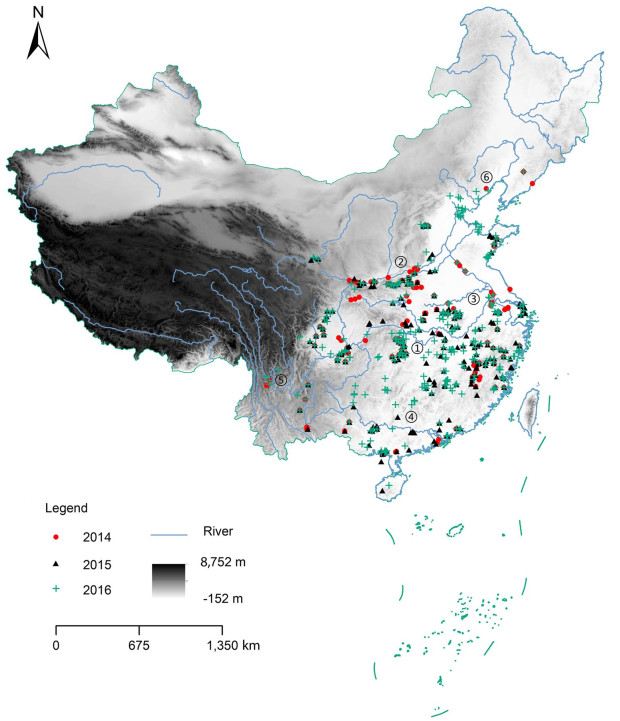
The three surveys covered 144, 223, 317 sites in 2014, 2015 and 2016 respectively (Fig. 1). These areas included mainstreams and branches of ten major basins (Yangtze River, Yellow River, Huaihe River, Zhujiang River, Lancang River, Liaohe River, Haihe River, Luanhe River, Changhua River and rivers at southeast coast) and adjacent reservoirs. Coastal areas and major artificial rivers such as Beijing-Hangzhou Grand Canal and Rivers of South-to-North Water Diversion Project were also surveyed. The distance from the south to the north is c. 2600 km and east to west is c. 2400 km. In total, 441, 634 and 1138 individuals of M. squamatus were recorded in winters of 2014, 2015 and 2016 respectively, the largest count almost 1/10–1/2 of its population size of 2400–10, 000 individuals (Wetlands International 2017).
Figure
1.
The survey sites in winters 2014–2016. 1 Yangtze River, 2 Yellow River, 3 Huaihe River, 4 Pearl River, 5 Lancang River, 6 Liaohe River
Scaly-sided Mergansers were recorded wintering not only in Jiangxi, Fujian, Chongqing, and Zhejiang provinces which have been known in historical records, but also in Hunan, Henan, Anhui and Hubei provinces with relatively large numbers (Table 2). Additionally, they were also found in south-western part of China, such as Guangxi. Dozens of new wintering sites were reported and two main sites in Dabie Mountain and East Qinling mountains were verified, with populations more than 100 respectively.
Table
2.
Numbers of Scaly-sided Mergansers recorded in its main distributed provinces in three winters
The training models fitted the survey data relatively well (Table 3). All training models had AUC greater than 0.75 (Table 3), and are suitable for conservation purposes according to Pearce and Ferrier (2000). Based on the Kappa coefficients (Landis and Koch 1977), the model for 2014 wintering season was the best, having substantial predictive power, and the 2015 model was the worst, its performance was fair (Kappa coefficient was 0.63, 0.33 and 0.56 for 2014, 2015 and 2016, respectively, Table 3). Similarly, the overall accuracy of the 2014 model was the highest (0.94, indicating 94% of the training cases were correctly predicted by the model, Table 3).
Table
3.
Measures of the predictive performance of the random forest species distribution models
Year
AUCa
OAAb
Kappac
Performance
2014
0.91 (0.84)
0.94 (0.92)
0.63 (0.52)
Substantial
2015
0.78 (0.71)
0.81 (0.76)
0.33 (0.28)
Fair
2016
0.91 (0.87)
0.84 (0.77)
0.56 (0.47)
Moderate
Values in parentheses are based on testing data, which are independent of the training data a Area under the receiver operating characteristic (AUC). Models with AUC values > 0.75 are suitable for conservation planning (Pearce and Ferrier 2000)
b OAA: Overall accuracy c Kappa coefficient: 0–0.20, slight; 0.21–0.40, fair; 0.41–0.60, moderate; 0.61–0.80, substantial; and 0.81–1, almost perfect, according to Landis and Koch (1977)
Using independent testing data (i.e. the testing data were randomly selected and were not included in model training), we verified the fitted models. The performance measures for model testing did not vary substantially from these for model training (Table 3), suggesting the stable performance of the fitted models.
Distribution range overlap and shift
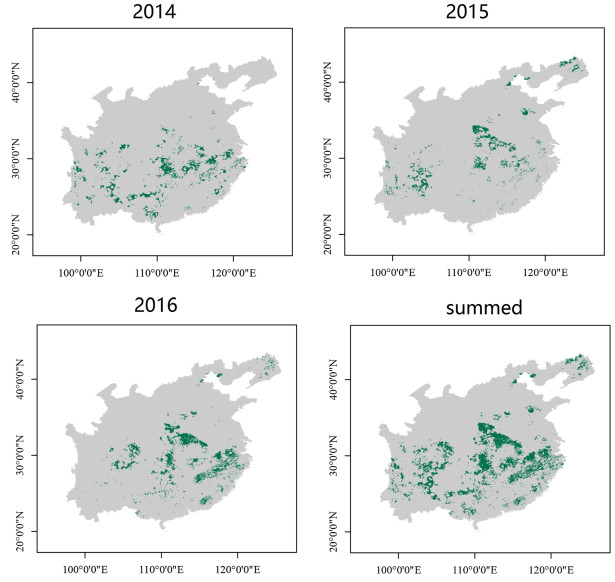
The predicted distributions of wintering distribution of M. squamatus in mainland China for 2014, 2015, 2016 and a maximum distribution range summed up three SDMs were presented in Fig. 2. Although there were thousands of habitat patches modelled for each year (Table 4), the patches were rather concentrated with the main distributions included in the river system of Dongting Watershed in Hunan, East Qinling mountains in Henan, Dabie Mountain in Anhui, and the river system of Poyang Watershed in Jiangxi (Fig. 2).
Figure
2.
Modelled wintering distribution area of M. squamatus in 2014–2016, and a maximum distribution range summing up three SDMs
The key landscape metrics of the predicted distribution range was reported in Table 4. Interestingly, although the number of survey sites increased year by year (138, 207 and 294, 2015 and 2016, respectively) and more birds were counted, the total number of habitat patches, the size of distribution range, and largest patch area did not increase accordingly (Table 4). The 2016 wintering distribution range was the largest, and the 2015 distribution was the smallest. In the 2014 wintering season, 5.01% of the total land (218, 839 km2, 6266 habitat patches) might be occupied by M. squamatus (Table 4). In 2015 winter, 165, 983 km2 (3.80% of the total land) and 6017 patches were predicted to be used by the duck. In 2016 winter, these values were 259, 863 km2 (total distribution area), 5.95% (percentage of land) and 8660 (number of habitat patches).
Schoener's D index was 0.96, 0.97, 0.99 between 2014 and 2015, 2014 and 2016, and 2015 and 2016, respectively, which indicated that the wintering range of M. squamatus was highly identical for the 3 years, especially between 2015 and 2016 (D = 0.99). The highly overlapped distribution ranges between years suggested that the wintering range of M. squamatus in mainland China were relatively stable.
Discussion
Wintering range
Over large spatial extents, range predictions are typically derived from expert knowledge, which are useful at coarse resolution, and suitable for delineating unoccupied regions (Merow et al. 2017). Point records with species distribution models could provide finer-scale occurrence information, which often rely on the availability of a sufficient amount of occurrence and/or abundance data representative of the species' distribution (Elith and Leathwick 2009). A sufficiently large volume of data with relatively lower per-datum information content can contain more information for broad-scale species distribution estimates than a smaller amount of higher quality data (Hochachka et al. 2012). Normally, established large-scale monitoring programs are limited to the breeding season, and relatively few data are available about bird populations during migration and winter (Munson et al. 2010). The 3-year wintering surveys operated consistently and at broad geographic scale, contributed a great deal of information about the wintering range of M. squamatus.
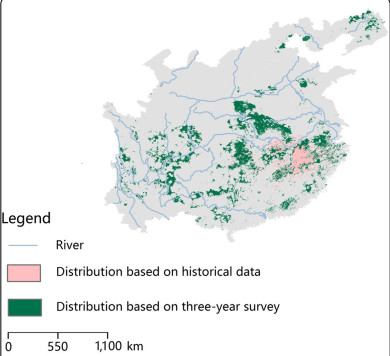
Prior to the citizen science surveys by CBA, there were several national and regional surveys, notably the National Terrestrial Wildlife Resources Surveys organized by Chinese State Forestry Administration, and regional waterbirds surveys covering the middle and lower Yangtze and coastal regions. These surveys found that the majority of the wintering M. squamatus flocks were located along the lower Yangtze River, especially in Jiangxi Province (He et al. 2002, 2006). Targeted single species surveys were later designed specifically for M. squamatus in Jiangxi Province and southern China by several institutes and research teams, and confirmed that the majority of M. squamatus wintered in Jiangxi Province (Barter et al. 2014). Many studies have been compromised by the logistical or financial challenge of collecting data, and large-scale surveys are most likely not feasible for one individual expert or team (Kelling et al. 2009). Citizen science with scientific research conducted, in whole or in part, by nonprofessional scientists, is an alternative and provides advantages over conventional science (Hand 2010). In addition to the field surveys, geolocators logging (Solovyeva et al. 2012) and satellite tracking devices (Liu et al. 2014) were used to identify the wintering grounds of this species. However, these techniques were limited by either inaccuracy or small sample size, and did not delineate the entire distribution range. The 3-year citizen science surveys found that the wintering range of M. squamatus was much more widely dispersed than previous reported, and Henan, Hunan and Hubei provinces were found to support large populations. The two main sites in Dabie Mountains and East Qinling Mountains provided updated knowledge of wintering distribution of the species in these areas. And the surveys are consistent with a previous study, which used Maxent model based on historical data to predict wintering distributions (Zeng et al. 2015b). Maxent with presence-only data produced a map of occurrence probability, and a threshold was used to transfer the probability to presence/absence. Therefore, the threshold had a great effect on the distribution map. However, the random forest models used observed presence/absence data in the study area and it should be more accurate, while largely depends on the data quality. Both studies with Maxent model and random forest models suggested that rivers in Jiangxi, Hunan and Hubei provinces were highly suitable habitats for the endangered duck (Fig. 3), while the 3-year surveys define a larger wintering range. Some sections of rivers recommended to be systematically surveyed by Zeng et al. (2015b) have been visited during this study; M. squamatus were recorded on Xiangjiang River in Hunan Province, but not on Futun and Nanpu rivers in Fujian Province. More rivers ought to be included for the surveys in the future.
Figure
3.
Comparison of modelled wintering range between the three-year study and previous study on historical data
Data-collection methodologies affect the robustness of results (Kelling et al. 2009). When properly designed, carried out and evaluated with appropriate protocols, training and oversight, volunteers can efficiently generate high-quality data equal to those collected by experts. Therefore, citizen science can provide sound science and help solve problems (Danielsen et al. 2014; McKinley et al. 2017). In a case study in Australia, strong correlations in reporting rates of bird species were found between informal area searches in locations selected by volunteers, and similar searches conducted using a formal stratified-random design (Szabo et al. 2012). Although the national-scale survey shows its supremacy on prediction of the wintering distribution of M. squamatus, we have to accept that it presents challenges of observer capability and variability that are not easily addressed (Weir et al. 2005). The small count of M. squamatus in 2014 might be due to first-time effect among observers, who tend to have lower counts in the first year they surveyed (Sauer et al. 1994; Kendall et al. 1996). And the counted number of 1138 in 2016 also indicated a gap between wintering and breeding population. It failed to reveal the real population for the deficiency of spatial coverage and temporal extent. Although the surveys covered the main watersheds, investigation coverage was relatively poor due to low manpower and large geographic area, as well as inaccessibility of some habitats, especially reservoirs. There is an increasing trend of abundance with the number of observers, while the limited data (number of surveys) prevents drawing reliable conclusions. The gap of numbers between field observations and population estimate may possibly be filled in by increased survey effort and coverage of more areas, which evidenced the great contribution of citizen science to the census of cryptic species.
The 3-year surveys are not long enough for accurate estimates of population size and trends. Reliable estimates of population trends will probably require > 5 years (and perhaps as much as 15–20 years) of survey data (Conway and Timmermans 2005). A study in southern Ontario of US used 45 years eBird data to estimate population change of twenty-two species (Walker and Taylor 2017). Using long term data to estimate population trends would be a promising avenue for future work. Long term and more focused surveys linked with the modelled distributions, are needed to accurately estimate the wintering population and its trend.
Conclusions
Operated consistently and at broad geographic scale, the 3-year wintering surveys contributed a great deal of occurrence and abundance data of M. squamatus at various sites across China. The highly overlapped distribution ranges between years suggested that the wintering sites of M. squamatus were relatively stable. While long-term efforts are needed to estimate population status and dynamics of wintering M. squamatus, we demonstrated that well organized and coordinated citizen science can be used to define the wintering habitats with accuracy. Organizing and engaging volunteers to collect the required data across broad scale has tremendous potential to provide information for management and conservation of natural resources in general for a range of species and habitats.
Authors' contributions
QZ conceived the study, contributed to the statistical analyses of the data and wrote the manuscript. QW organized the surveys and participated in the field study, and also helped with data preparation. GL contributed to the analyses of the survey data. All authors read and approved the final manuscript.
Acknowledgements
We would like to thank all the volunteers for their input concerning the 3-year surveys. We are also grateful to Dr. Wen Li from the Office of Environment and Heritage, NSW and Dr. Taej Mundkur from Wetlands International for their valuable comments.
Competing interests
The authors declare that they have no competing interests.
Availability of data and materials
The datasets used and/or analyzed during the current study are available from the corresponding author on reasonable request.
Barter M, Zhuang X, Wang X, Cao L, Lei J, Solovyeva D, Fox AD. Abundance and distribution of wintering Scaly-sided Mergansers Mergus squamatus in China: where are the missing birds? Bird Conserv Int. 2014;2014(24):406–15.
Bois ST, Silander JA Jr, Mehrhoff LJ. Invasive plant atlas of New England: the role of citizens in the science of invasive alien species detection. Bioscience. 2011;61:763–70.
Bonney R, Cooper CB, Dickinson J, Kelling S, Phillips T, Rosenberg KV, Shirk J. Citizen science: a developing tool for expanding science knowledge and scientific literacy. Bioscience. 2009;59:977–84.
Bonter DN, Harvey MG. Winter survey data reveal rangewide decline in Evening Grosbeak populations. Condor. 2008;110:376–81.
Breiman L. Statistical modeling: the two cultures (with comments and a rejoinder by the author). Stat Sci. 2001;16:199–231.
Chandler M, See L, Copas K, Bonde AM, López BC, Danielsen F, Legind JK, Masinde S, Miller-Rushing AJ, Newman G. Contribution of citizen science towards international biodiversity monitoring. Biol Conserv. 2017;213:280–94.
Conway CJ. Standardized North American marsh bird monitoring protocol. Waterbirds. 2011;34:319–46.
Conway CJ, Timmermans ST. Progress toward developing field protocols for a North American marshbird monitoring program. In: Ralph CJ, Rich TD, editors. Bird conservation implementation and integration in the Americas: proceedings of the third international partners in flight conference. Albany, California: US Department of Agriculture Forest Service; 2005. pp. 997–1005.
Danielsen F, Jensen PM, Burgess ND, Altamirano R, Alviola PA, Andrianandrasana H, Brashares JS, Burton AC, Coronado I, Corpuz N. A multicountry assessment of tropical resource monitoring by local communities. Bioscience. 2014;64:236–51.
Dickinson JL, Shirk J, Bonter D, Bonney R, Crain RL, Martin J, Phillips T, Purcell K. The current state of citizen science as a tool for ecological research and public engagement. Front Ecol Environ. 2012;10:291–7.
Elith J, Leathwick JR. Species distribution models: ecological explanation and prediction across space and time. Annu Rev Ecol Evol Syst. 2009;40:677–97.
Flather CH, Sauer JR. Using landscape ecology to test hypotheses about large-scale abundance patterns in migratory birds. Ecology. 1996;77:28–35.
Friedl MA, McIver DK, Hodges JC, Zhang X, Muchoney D, Strahler AH, Woodcock CE, Gopal S, Schneider A, Cooper A. Global land cover mapping from MODIS: algorithms and early results. Remote Sens Environ. 2002;83:287–302.
Grömping U. Variable importance assessment in regression: linear regression versus random forest. Am Stat. 2009;63:308–19.
Hand E. People power. Nature. 2010;466:685–7.
He F, Lin J, Yang B, Jiang H, Zhang H. Current distribution and status of the wintering Scaly-sided Merganser Mergus squamatus in China. Chin J Zool. 2006;41:52–6 (in Chinese).
He F, Melville D, Gui X, Hong Y, Liu Z. Status of the Scaly-sided Merganser wintering in mainland China in the 1990s. Waterbirds. 2002;25:462–4.
Hijmans R, Phillips S, Leathwick J. Elith J. dismo: species distribution modeling. R package version 0.9-3. 2015. . Accessed 12 Mar 2015.
Hijmans RJ, Van Etten J. raster: geographic data analysis and modeling. R package version 2.2-31. 2014. . Accessed 15 Mar 2014.
Hochachka WM, Fink D, Hutchinson RA, Sheldon D, Wong W-K, Kelling S. Data-intensive science applied to broad-scale citizen science. Trends Ecol Evol. 2012;27:130–7.
Hu R, Wen C, Gu Y, Wang H, Gu L, Shi X, Zhong J, Wei M, He F, Lu Z. A bird's view of new conservation hotspots in China. Biol Conserv. 2017;211:47–55.
IUCN. Mergus squamatus. 2017. . Accessed 1 Dec 2017.
Kelling S, Hochachka WM, Fink D, Riedewald M, Caruana R, Ballard G, Hooker G. Data intensive science: a new paradigm for biodiversity studies. Bioscience. 2009;59:613–20.
Kendall WL, Peterjohn BG, Sauer JR. First-time observer effects in the North American breeding bird survey. Auk. 1996;113:823–9.
Landis JR, Koch GG. An application of hierarchical kappa-type statistics in the assessment of majority agreement among multiple observers. Biometrics. 1977;33:363–74.
Liaw A, Wiener M. Classification and regression by randomForest. R News. 2002;2:18–22.
Liu D, Li C, Zhang G, Lu J, Chen G. Satellite tracking of Scaly-sided Merganser (Mergus squamatus) breeding in Lesser Xingan Mountains, China. Waterbirds. 2014;37:432–8.
Losey JE, Perlman JE, Hoebeke ER. Citizen scientist rediscovers rare nine-spotted lady beetle, Coccinella novemnotata, in eastern North America. J Insect Conserv. 2007;11:415–7.
Ma Z, Cheng Y, Wang J, Fu X. The rapid development of birdwatching in mainland China: a new force for bird study and conservation. Bird Conserv Int. 2013;23:259–69.
McKinley DC, Miller-Rushing AJ, Ballard HL, Bonney R, Brown H, Cook-Patton SC, Evans DM, French RA, Parrish JK, Phillips TB. Citizen science can improve conservation science, natural resource management, and environmental protection. Biol Conserv. 2017;208:15–28.
Merow C, Wilson AM, Jetz W. Integrating occurrence data and expert maps for improved species range predictions. Glob Ecol Biogeogr. 2017;26:243–58.
Munson MA, Caruana R, Fink D, Hochachka WM, Iliff M, Rosenberg KV, Sheldon D, Sullivan BL, Wood C, Kelling S. A method for measuring the relative information content of data from different monitoring protocols. Methods Ecol Evol. 2010;1:263–73.
Oliveira S, Oehler F, San-Miguel-Ayanz J, Camia A, Pereira JM. Modeling spatial patterns of fire occurrence in mediterranean Europe using multiple regression and random forest. For Ecol Manag. 2012;275:117–29.
Pearce J, Ferrier S. Evaluating the predictive performance of habitat models developed using logistic regression. Ecol Model. 2000;133:225–45.
R Development Core Team. The R project for statistical computing. 2016. . Accessed 12 Dec 2012.
Rödder D, Engler J. Quantitative metrics of overlaps in Grinnellian niches: advances and possible drawbacks. Glob Ecol Biogeogr. 2011;20:915–27.
Sauer JR, Link WA, Fallon JE, Pardieck KL, Ziolkowski DJ Jr. The North American breeding bird survey 1966–2011: summary analysis and species accounts. N Am Fauna. 2013;79:1–32.
Sauer JR, Peterjohn BG, Link WA. Observer differences in the North American breeding bird survey. Auk. 1994;111:50–62.
Schoener TW. The Anolis lizards of Bimini: resource partitioning in a complex fauna. Ecology. 1968;49:704–26.
Siroky DS. Navigating random forests and related advances in algorithmic modeling. Stat Surv. 2009;3:147–63.
Solovyeva DV, Afanasiev V, Fox JW, Shokhrin V, Fox AD. Use of geolocators reveals previously unknown Chinese and Korean scaly-sided merganser wintering sites. Endanger Species Res. 2012;17:217–25.
Solovyeva DV, Liu P, Antonov AI, Averin AA, Pronkevich VV, Shokhrin VP, Vartanyan SL, Cranswick PA. The population size and breeding range of the Scaly-sided Merganser Mergus squamatus. Bird Conserv Int. 2014;24:393–405.
Szabo JK, Fuller RA, Possingham HP. A comparison of estimates of relative abundance from a weakly structured mass-participation bird atlas survey and a robustly designed monitoring scheme. Ibis. 2012;154:468–79.
VanDerWal J, Falconi L, Januchowski S, Shoo L, Storlie C. Package SDMTools—species distributionn modelling tools: tools for processing data associated with species distribution modeling exercises. Version 1.1-221. CRAN; 2014.
Walker J, Taylor P. Using eBird data to model population change of migratory bird species. Avian Conserv Ecol. 2017;12:4.
Weir LA, Royle JA, Nanjappa P, Jung RE. Modeling anuran detection and site occupancy on North American amphibian monitoring program (NAAMP) routes in Maryland. J Herpetol. 2005;39:627–39.
Wen L, Saintilan N, Yang X, Hunter S, Mawer D. MODIS NDVI based metrics improve habitat suitability modelling in fragmented patchy floodplains. Remote Sens Appl Soc Environ. 2015;1:85–97.
Wetlands International. Waterbird population estimates. 2017. . Accessed 15 Dec 2017.
Wood C, Sullivan B, Iliff M, Fink D, Kelling S. eBird: engaging birders in science and conservation. PLoS Biol. 2011;9:e1001220.
Zeng Q, Lu C, Li G, Guo Z, Wen L, Lei G. Impact of a dam on wintering waterbirds' habitat use. Environ Conserv. 2017. .
Zeng Q, Shi L, Wen L, Chen J, Duo H, Lei G. Gravel bars can be critical for biodiversity conservation: a case study on Scaly-sided Merganser in South China. PLoS ONE. 2015a;10:e0127387.
Zeng Q, Zhang Y, Sun G, Duo H, Wen L, Lei G. Using species distribution model to estimate the wintering population size of the endangered Scaly-sided Merganser in China. PLoS ONE. 2015b;10:e0117307.
Qiwei Ma, Li Yu, Lihua Xu, et al. Can ecological networks established through interactions of multi-species conservation priorities maintain biodiversity and contain urban development?. Journal for Nature Conservation, 2025, 84: 126853.
DOI:10.1016/j.jnc.2025.126853
2.
Yulong Shen, Ye Gong, Diana Solovyeva, et al. Genetic diversity and shallow genetic differentiation of the endangered scaly‐sided merganser Mergus squamatus. Ecology and Evolution, 2024, 14(7)
DOI:10.1002/ece3.70011
3.
Samuel T. Turvey, Heidi Ma, Tonglei Zhou, et al. Local ecological knowledge and regional sighting histories of Hainan Peacock-pheasant Polyplectron katsumatae: pessimism or optimism for a threatened island endemic?. Bird Conservation International, 2023, 33
DOI:10.1017/S095927092200020X
4.
Sheng-Quan Fang, Yong-Ping Li, Yue Pan, et al. Butterfly Diversity in a Rapidly Developing Urban Area: A Case Study on a University Campus. Diversity, 2023, 16(1): 4.
DOI:10.3390/d16010004
5.
Peizhong Liu, Meihan Liu, Dongyang Xiao, et al. Scaly-sided Merganser (Mergus squamatus) equalizes foraging costs with depth by switching foraging tactics. Avian Research, 2023, 14: 100129.
DOI:10.1016/j.avrs.2023.100129
6.
Houlang Duan, Xiubo Yu, Shaoxia Xia, et al. Comparison of IUCN and species distribution modeling-estimated ranges of shorebirds in Coastal Mainland China. Global Ecology and Conservation, 2022, 38: e02236.
DOI:10.1016/j.gecco.2022.e02236
7.
Rochelle Steven, Bronte E. Van Helden, Ayesha I. Tulloch, et al. Exploring the ability of urban householders to correctly identify nocturnal mammals. Urban Ecosystems, 2021, 24(6): 1359.
DOI:10.1007/s11252-021-01118-2
8.
Ruocheng Hu, Yiyun Gu, Mei Luo, et al. Shifts in bird ranges and conservation priorities in China under climate change. PLOS ONE, 2020, 15(10): e0240225.
DOI:10.1371/journal.pone.0240225
9.
Yan Zhou, Anping Chen, Jenny Q. Ouyang, et al. Comparing community birdwatching and professional bird monitoring with implications for avian diversity research: a case study of Suzhou, China. Avian Research, 2020, 11(1)
DOI:10.1186/s40657-020-00205-w
10.
Xiongwei Huang, Congtian Lin, Liqiang Ji. The persistent multi-dimensional biases of biodiversity digital accessible knowledge of birds in China. Biodiversity and Conservation, 2020, 29(11-12): 3287.
DOI:10.1007/s10531-020-02024-3
11.
An An, Lei Cao, Qiang Jia, et al. Changing Abundance and Distribution of the Wintering Swan Goose Anser cygnoides in the Middle and Lower Yangtze River Floodplain: An Investigation Combining a Field Survey with Satellite Telemetry. Sustainability, 2019, 11(5): 1398.
DOI:10.3390/su11051398
12.
Xiaodan Wang, Fenliang Kuang, Kun Tan, et al. Population trends, threats, and conservation recommendations for waterbirds in China. Avian Research, 2018, 9(1)
DOI:10.1186/s40657-018-0106-9
13.
An An, Yong Zhang, Lei Cao, et al. A potential distribution map of wintering Swan Goose (Anser cygnoides) in the middle and lower Yangtze River floodplain, China. Avian Research, 2018, 9(1)
DOI:10.1186/s40657-018-0134-5
Table
3.
Measures of the predictive performance of the random forest species distribution models
Year
AUCa
OAAb
Kappac
Performance
2014
0.91 (0.84)
0.94 (0.92)
0.63 (0.52)
Substantial
2015
0.78 (0.71)
0.81 (0.76)
0.33 (0.28)
Fair
2016
0.91 (0.87)
0.84 (0.77)
0.56 (0.47)
Moderate
Values in parentheses are based on testing data, which are independent of the training data a Area under the receiver operating characteristic (AUC). Models with AUC values > 0.75 are suitable for conservation planning (Pearce and Ferrier 2000)
b OAA: Overall accuracy c Kappa coefficient: 0–0.20, slight; 0.21–0.40, fair; 0.41–0.60, moderate; 0.61–0.80, substantial; and 0.81–1, almost perfect, according to Landis and Koch (1977)

 DownLoad:


 Email Alerts
 RSS Feeds