Ministry of Education Key Laboratory for Biodiversity Science and Ecological Engineering, School of Life Sciences, Fudan University, Shanghai 200433, China
Funds:
the National Natural Science Foundation of China32071646
the National Key Research and Development Program of China2022YFF0802400
To halt biodiversity loss, threatened species are often selected as targets for conservation actions. However, whether most threatened species receive sufficient research effort remains unknown. Low research and public attention of threatened species would hinder the implementation of effective conservation actions. Therefore, it is urgent to assess both research effort and species extinction risk simultaneously to provide critical information for targeted conservation practices. Here, we evaluated research effort of extant bird species worldwide (n = 10,904) by searching the number of all publications and those focused on conservation in Scopus database for each species, and investigated key determinants of research effort. We found that although the median value of publications of threatened species was significantly higher than that of non-threatened species, 47.4% of threatened species had less than 3 publications, and 73.8% had less than 10 publications, indicating low research effort of most threatened species. Although research effort was positively related to extinction risk, research effort was mainly associated with human-related variables, with birds described earlier and occurred in developed regions receiving higher research effort. In comparison, extinction risk was mainly associated with biological attributes, with large-sized and narrow-distributed species being more likely to be threatened. Our finding suggests that research effort of species can provide complementary information for current conservation strategies designed for threatened species, and we urge that many recently discovered and narrowly distributed species in less developed regions require more research and conservation attention.
Targeted conservation actions are particularly important to reverse biodiversity loss. To prevent species from extinction, research efforts and conservation actions often target at threatened species due to their high risk of extinction (Jetz et al., 2014). Therefore, some threatened species have received disproportionally high research and conservation efforts (Scott et al., 2010; Albert et al., 2018), and such actions have been proven effective. For instance, the Endangered Giant Panda (Ailuropoda melanoleuca) was downgraded to Vulnerable by the International Union for Conservation of Nature (IUCN) Red List criteria owing to conservation efforts focused on this flagship species (IUCN, 2021, Xu et al., 2017), and up to 48 threatened bird and mammal species were prevented from extinction during 1993–2020 due to conservation efforts (Bolam et al., 2021). However, whether most threatened species receive sufficient research effort remains unknown. For example, the Giant Panda, one of the most famous threatened species, attracted more than 50% of overall carnivoran research resources in China (Wang et al., 2021). In comparison, an assessment based on 697 threatened mammal species and 100 critically endangered amphibian species showed that 75% of mammals and 90% of amphibians were not included in any conservation research (Sitas et al., 2009). Since scientific research provides the basic knowledge for developing conservation policies and actions (Sutherland et al., 2004; Fuller et al., 2007; Tilman et al., 2017), low research effort of threatened species would hamper the effectiveness of conservation actions (Courchamp et al., 2018; Fukano et al., 2020). Therefore, it is urgent to evaluate research effort of both threatened and non-threatened species to provide critical information to guide targeted conservation practices.
Whether threatened species would receive higher research effort, which can be quantified as the number of all published papers for a specific species (Clark and May, 2002), than non-threatened ones is still unclear. On one hand, species with high extinction risk, such as Tiger (Panthera tigris) and Giraffe (Giraffa camelopardalis) have received relatively high research effort because of their charisma (Albert et al., 2018; Berti et al., 2020). The pattern that threatened species have relatively higher research effort is also widely reported in birds (McKenzie and Robertson, 2015; Devenish-Nelson et al., 2019) and reptiles (Trimble and van Aarde, 2010; Guedes et al., 2023). On the other hand, there are also some case studies showing that threatened species would receive lower research effort. For example, an assessment based on 824 articles related to birds published in six international conservation journals during 2000 and 2005 found that most of the published research focuses on non-threatened species (Brito and Oprea, 2009). This can be explained by several reasons. First, many threatened species have narrow distribution ranges and small population sizes (Böhm et al., 2016), which makes them rarely discovered and studied (Tam et al., 2022). For example, as reported by de Lima et al. (2011), more than half of threatened island birds with narrow distribution ranges have not been reported in any scientific articles. Second, many threatened species are found exclusively in biodiversity hotspots with low human accessibility and research capability, making them difficult to be collected and investigated (Pimm et al., 2014; Zhang et al., 2023). Third, since threatened species are rare, collecting such species as research materials is restricted under conservation laws and regulations (Guedes et al., 2023).
Apart from extinction risk, research effort will also be influenced by other factors, which can be divided into intrinsic biological traits and extrinsic socioeconomic factors (Tam et al., 2022; Guedes et al., 2023). As for biological traits, body mass, range size, and population size have been widely proved to be strong predictors of research effort (Ducatez and Lefebvre, 2014; Murray et al., 2015). Species that are large, have a wide distribution range and high population size are easier to be detected and observed, thus receiving higher research effort. Previous study also proved that species with narrow habitat breadth and generation length are more likely to receive lower research effort (Devenish-Nelson et al., 2019). Moreover, research effort also highly associated with socioeconomic factors (Jarić et al., 2022). For example, species living in more developed countries would receive more research effort (Ibáñez-Álamo et al., 2017; Santos et al., 2020). In addition, research effort might also be influenced by species traits related to human preference. For instance, charismatic species tend to receive more research effort because of their attractivity to the public (Zhang et al., 2014). A study on plants in southwestern Alps found that species with colorful and large flowers have received more research effort than species with inconspicuous flowers (Adamo et al., 2021). Similarly, another study focused on 472 bird species showed that larger and more colorful species would be more reported in eBird and iNaturalist, two popular citizen science observation platform (Stoudt et al., 2022).
To date, although there are some case studies investigating the drivers of research effort at different spatial scales (Ducatez and Lefebvre, 2014; Murray et al., 2015; Devenish-Nelson et al., 2019) or exploring the drivers of extinction risk and research effort for a small group of species (Buechley et al., 2019), there is no study that assesses the relationship between extinction risk and research effort simultaneously for all known bird species at the global scale, representing a major knowledge gap to guide targeted conservation efforts.
Here, we used bird species as research subject to investigate the pattern and determinants of research effort at the global scale. We compiled data for 10,904 bird species of the world by using the number of all publications and conservation-related publications in Scopus database to represent research effort, and IUCN Red List threatened status to represent extinction risk for each species. We first mapped the pattern of research effort for both threatened and non-threatened species, then assessed the relationship between extinction risk and research effort across bird species at the global scale, finally we evaluated their key determinants. We used birds mainly because they are the most studied taxa among vertebrates with complete and available trait databases (Troudet et al., 2017; Ducatez et al., 2020; Callaghan et al., 2021; Tobias et al., 2022).
2.
Materials and methods
2.1
Species list of global birds
We extracted species list of global birds from BirdLife International (2020) on July 18, 2021, which is the most authoritative and widely used global database in ornithological research. There were 11,009 bird species from 243 families in the species list. We removed 11 domesticated species because they were likely to have inflated publication numbers that may not be comparable to those of wild species (Tam et al., 2022) and most of the publications were not related to ecology or conservation. Thus, 10,998 species were kept for further analyses.
We used Scopus database because it is one of the largest literature search databases, with a broader journal coverage compared with Web of Science (Mongeon and Paul-Hus, 2016). In addition, a R package, 'rscopus' (Muschelli, 2019), is available to retrieve and extract data effectively. We retrieved all publications and conservation-related publications of each species to get a more comprehensive understanding of research effort.
For all publications, we used the following query: TITLE-ABS-KEY ("scientific name" OR "common name"). We used both the Latin name and the common name (in English) of each species to revise biases caused by taxonomic revisions of scientific names (Guedes et al., 2023). The common name of each species was extracted from IUCN Red List (IUCN, v.2021–1). For conservation-related publications, we used the following query: TITLE-ABS-KEY ("scientific name" OR "common name" AND conserv*) AND DOCTYPE (ar). We added "conserve, conservation" as topic and limited the document type to "article" to ensure that the retrieved publications were focused on conservation-related research. We performed the searches in all available databases with publication year between 1900 and 2023. The searches were all conducted in January 2024.
2.3
Quantification of extinction risk
To assess species extinction risk, we used the threatened status assigned by the IUCN Red List (IUCN, v.2021–1) criteria as a proxy (Mace et al., 2008). Species classified as Least Concern (LC), Near Threatened (NT), Vulnerable (VU), Endangered (EN) or Critically Endangered (CR) were included, and they were assumed to have increasing extinction risk. We considered species classified as LC and NT as "non-threatened", while species classified as VU, EN and CR as "threatened". We excluded species classified as Data Deficient (DD), Extinct in the Wild (EW) and Extinct (EX) because we only focused on extant species with assessed extinction risk. We removed 94 species, which accounted for a small proportion (0.9%) of total species. Finally, 10,904 species were used for further analyses.
2.4
Mapping spatial pattern of research effort
For each species, the latitude and longitude coordinates of their centroid of distribution range (11,009 species) were extracted from the AVONET dataset (Tobias et al., 2022). Centroid of latitude and longitude were also used to plot the global distribution map of research effort. To compare the differences of publication numbers among climatic zones, we first applied Kruskal–Wallis test (Kruskal and Wallis, 1952) to test whether there were significant differences between multiple groups and then applied Dunn's test with Bonferroni correction to determine the differences between pairs (Dunn, 1964).
2.5
Species-level predictors
To investigate the determinants of research effort and extinction risk of global birds, we selected 10 relevant biological and socioeconomic species-level predictors according to previous studies, including body mass, range size, habitat breadth, generation length, migratory behavior, attractiveness to human, description year, latitude, urban occurrence, and human usage. We assume that extinction risk is mainly associated with biological attributes, while research effort is mainly associated with socioeconomic factors (Jarić et al., 2022; Mashayekhi et al., 2014). For biological predictors, our predictions are: body mass and generation length are positively related to research effort and extinction risk (Ducatez and Lefebvre, 2014; Murray et al., 2015; Chichorro et al., 2019; Devenish-Nelson et al., 2019; Fromm and Meiri, 2021); while range size, habitat breadth are positively related to research effort but negatively related to extinction risk (Pimm et al., 1988; Ducatez and Lefebvre, 2014; Devenish-Nelson et al., 2019); the influence of migratory behavior is uncertain (Ducatez and Lefebvre, 2014; McKenzie and Robertson, 2015). For socioeconomic predictors, our predictions are: species that described earlier, distribute in high-latitude and urban areas would receive higher research effort and have lower extinction risk (Ibáñez-Álamo et al., 2017; Santos et al., 2020; Liu et al., 2022; Tam et al., 2022); attractive species would receive higher research effort (Santangeli et al., 2023); species utilized by human have both higher extinction risk and research effort (Tam et al., 2022).
Body mass (11,009 species), range size (10,952 species), centroid of latitude and longitude (11,009 species), and migratory behavior (10,986 species) data were extracted from the AVONET dataset (Tobias et al., 2022). Habitat breadth, generation length and urban occurrence data were extracted from a newly published data paper for 8645 global bird species (Ducatez et al., 2020). Habitat breadth for each species was calculated based on both the number of IUCN habitat types it occurred and the number of cooccurring vertebrate species within each habitat type following Ducatez et al. (2014). Attractiveness to human data was extracted from a newly published paper for 11,187 bird species (Santangeli et al., 2023), which was quantified as the average of human ratings on the appearance of each bird species (scale from 1 to 10 of increasing attractiveness; > 400,000 scores for > 11,000 bird species; ranging from 3.3 to 8.4). Description year and human usage data were extracted from the IUCN Red List (IUCN, v.2021-1) for 11,158 species. As for human usage, species listed in the "trade and use" section in IUCN Red List was classified as used by human (IUCN, v.2021-1). Detailed sources and references for each predictor can be found in Appendix Table S1.
Data completeness for each species-level predictor ranged from 78.4% to 100%. To fill the missing data, we first used genus-level mean values and then used family-level mean values when the former data were not available. The final dataset contained 10,452 species with complete predictor data.
2.6
Statistical analysis
To compare the differences of publication numbers between threatened and non-threatened species, we applied Wilcoxon signed-rank test (Wilcoxon, 1992) because the distributions of publication numbers were not normal. To compare the differences of publication numbers among IUCN threatened statuses, we first applied Kruskal–Wallis test (Kruskal and Wallis, 1952) to test whether there were significant differences between multiple groups and then applied Dunn's test with Bonferroni correction to determine the differences between pairs (Dunn, 1964). To compare differences in equitability of publication numbers among groups, we calculated Pielou's evenness index of each group based on standardized number of publications following de Lima et al. (2011). The publication data were standardized by splitting the number of publications for each species by the highest number of publications recorded in Scopus database. Pielou's evenness index equals 1 meaning that all species of that group had the same number of publications.
To explore the relative importance of each predictor associated with species research effort and extinction risk, we applied generalized linear mixed effects models (GLMMs) for 10,452 species using the 'glmmTMB' package (Brooks et al., 2017) in R v.4.1.2 (R Core Team, 2022). The response variables were all publications, conservation-related publications, and IUCN threatened status ("0" for non-threatened and "1" for threatened species), respectively. Research effort models were fitted with a negative binomial distribution to solve overdispersion. Extinction risk model was fitted with a binomial distribution. Fixed effects included ten predictors: body mass (Log10-transformed), range size (Log10-transformed), habitat breadth, generation length, migratory behavior ("0" for non-migratory and "1" for migratory), attractiveness to human, description year, centroid of latitude (absolute value), urban occurrence ("0" for no occurrence and "1" for occurrence), and human usage ("0" for no use and "1" for use). Prior to analysis, we checked the correlation between continuous predictors and found low correlation (Pearson correlation test, r < 0.7; Appendix Fig. S1). The variance inflation factor (VIF) values for all predictors in the models were < 2, indicating low multicollinearity. Then, all predictors were z-transformed (centered and scaled) to obtain standardized and comparable coefficients. Random effects included nested taxonomic information (family within order), which was added to account for potential phylogenetic relationships of research effort between species (Ducatez and Lefebvre, 2014; Tam et al., 2022). Finally, we used the 'r.squaredGLMM' function in 'MuMIn' package (Bartoń, 2024) in R v.4.1.2 (R Core Team, 2022) to calculate the marginal and conditional R2 for three models.
3.
Results
3.1
Distribution pattern of research effort
The number of publications varied substantially among species, showing a highly right-skewed distribution (Fig. 1A and B). For all publications, we collected 237,722 publications for 10,904 species, ranging from 0 to 7678 publications per species (median = 2, mean = 21.8, SD = 119.1), with 26.5% species had no publications and top 1% most-studied species accounting for 36.4% of total publications. The top five most-studied species are: Japanese Quail (Coturnix japonica, 7678 publications), Common Quail (Coturnix coturnix, 2932 publications), Great Tit (Parus major, 2925 publications), Timor Zebra Finch (Taeniopygia guttata, 2674 publications) and House Sparrow (Passer domesticus, 2432 publications), which are all non-threatened species. The similar pattern was observed in conservation-related publications. For conservation-related publications, we collected 33,754 publications for 10,904 species, ranging from 0 to 379 publications per species (median = 0, mean = 3.1, SD = 11.2), with 59.0% species had no publications and top 1% most-studied species accounting for 28.9% of total publications. The top five most-studied species are: Sage Grouse (Centrocercus urophasianus, 379 publications), Spotted Owl (Strix occidentalis, 236 publications), Timor Zebra Finch (Taeniopygia guttata, 186 publications), Golden Eagle (Aquila chrysaetos, 181 publications) and Japanese Quail (Coturnix japonica, 169 publications), which are all non-threatened species.
Figure
1.
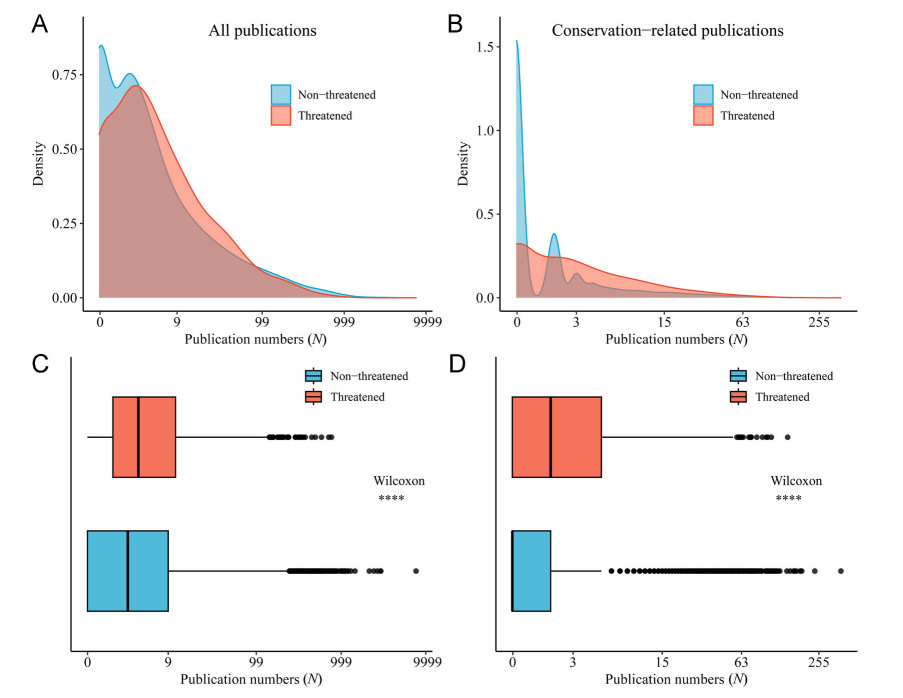
(A, B) Probability density plots and (C, D) comparisons of differences of the number of (A, C) all publications and (B, D) conservation-related publications between threatened (n = 1474) and non-threatened (n = 9430) species. (C, D) Significant differences were labelled with asterisks: *P < 0.05, **P < 0.01, ***P < 0.001. Species classified as Least Concern and Near Threatened are defined as "non-threatened", while species classified as Vulnerable, Endangered and Critically Endangered are defined as "threatened". In order to better visualize the data, we added 1 to the original number of publications and then log-transformed (base 10 for all publications and base 2 for conservation-related publications).
The right-skewed distribution was observed in both non-threatened and threatened species (Fig. 1A and B). The median of all publications of non-threatened species (n = 9430, median = 2, mean = 22.7, SD = 126.5) was significantly lower than that of threatened species (n = 1,474, median = 3, mean = 16.2, SD = 50.7; Wilcoxon signed-rank test, P < 0.001; Fig. 1C). Similarly, the median of conservation-related publications of non-threatened species (median = 0, mean = 2.8, SD = 11.2) was significantly lower than that of threatened species (median = 1, mean = 4.7, SD = 11.0; Wilcoxon signed-rank test, P < 0.001; Fig. 1D). Pielou's evenness indices showed that the number of publications was more evenly distributed among threatened species than non-threatened species (Table 1). However, 47.4% of threatened species had less than three publications, and 73.8% had less than 10 publications, indicating low research effort of most threatened species.
Table
1.
Differences of research effort biases between threatened and non-threatened species and among IUCN threatened statuses.
Comparison
Pielou's evenness indices
n1
n2
All publication numbers
TR – NO
0.813
0.790
1474
9430
LC – NT
0.799
0.618
8432
998
LC – VU
0.799
0.786
8432
792
LC – EN
0.799
0.779
8432
460
LC – CR
0.799
0.784
8432
222
NT – VU
0.618
0.786
998
792
NT – EN
0.618
0.779
998
460
NT – CR
0.618
0.784
998
222
VU – EN
0.786
0.779
792
460
VU – CR
0.786
0.784
792
222
EN – CR
0.779
0.784
460
222
Conservation-related publication numbers
TR – NO
0.882
0.869
1474
9430
LC – NT
0.875
0.787
8432
998
LC – VU
0.875
0.860
8432
792
LC – EN
0.875
0.855
8432
460
LC – CR
0.875
0.885
8432
222
NT – VU
0.787
0.860
998
792
NT – EN
0.787
0.855
998
460
NT– CR
0.787
0.885
998
222
VU – EN
0.860
0.855
792
460
VU – CR
0.860
0.885
792
222
EN – CR
0.855
0.885
460
222
Pielou’s evenness indices were calculated to measure the equitability within each status. TR – “Threatened”; NO – “non-threatened”; LC – “Least Concern”; NT – “Nearly Threatened”; VU – “Vulnerable”; EN – “Endangered”; CR – “Critically Endangered”. n1 and n2 are the number of species for the former and latter IUCN threatened status, respectively.
3.2
Relationship between extinction risk and research effort
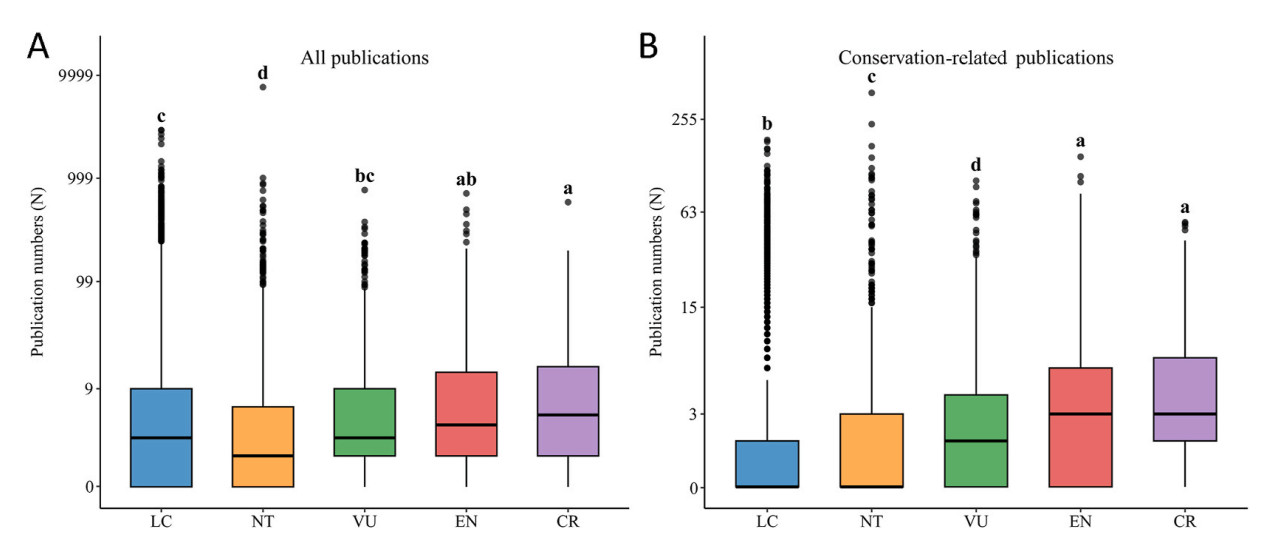
For all publications, Dunn's test results showed that the medians of CR (n = 222, median = 4, mean = 16.2, SD = 46.7) and EN (n = 460, median = 3, mean = 18.5, SD = 57.4) species were significantly higher than that of LC (n = 8432, median = 2, mean = 22.2, SD = 101.2) and NT species (n = 998, median = 1, mean = 26.8, SD = 254.6) (Dunn's test, P < 0.001 for paired IUCN threatened statuses; Fig. 2A), indicating that species with higher extinction risk received higher research effort. For conservation-related publications, the positive relationship between IUCN threatened status and research effort was more obvious: the medians of CR (median = 2, mean = 5.6, SD = 9.0) and EN (median = 2, mean = 5.6, SD = 13.3) species were the highest, followed by VU (n = 792, median = 1, mean = 3.9, SD = 9.9), NT (median = 0, mean = 4.7, SD = 19.9), LC (median = 0, mean = 2.6, SD = 9.7) species (Dunn's test, P < 0.001 for paired IUCN threatened statuses; Fig. 2B).
Figure
2.
Boxplots and comparisons of differences of the number of (A) all publications and (B) conservation-related publications among different IUCN threatened statuses, classified as Least Concern (n = 8432), Near Threatened (n = 998), Vulnerable (n = 792), Endangered (n = 460), Critically Endangered (n = 222). The boxplots represented median (middle black line), 25th and 75th percentiles (box), and 1.5 × interquartile range (whiskers) of publication numbers. The same letters indicated insignificant differences and different letters indicated significant differences, with a significant level α = 0.05. Letters a to d indicated decreasing values. In order to better visualize the data, we added 1 to the original number of publications and then log-transformed (base 10 for all publications, and base 2 for conservation-related publications).
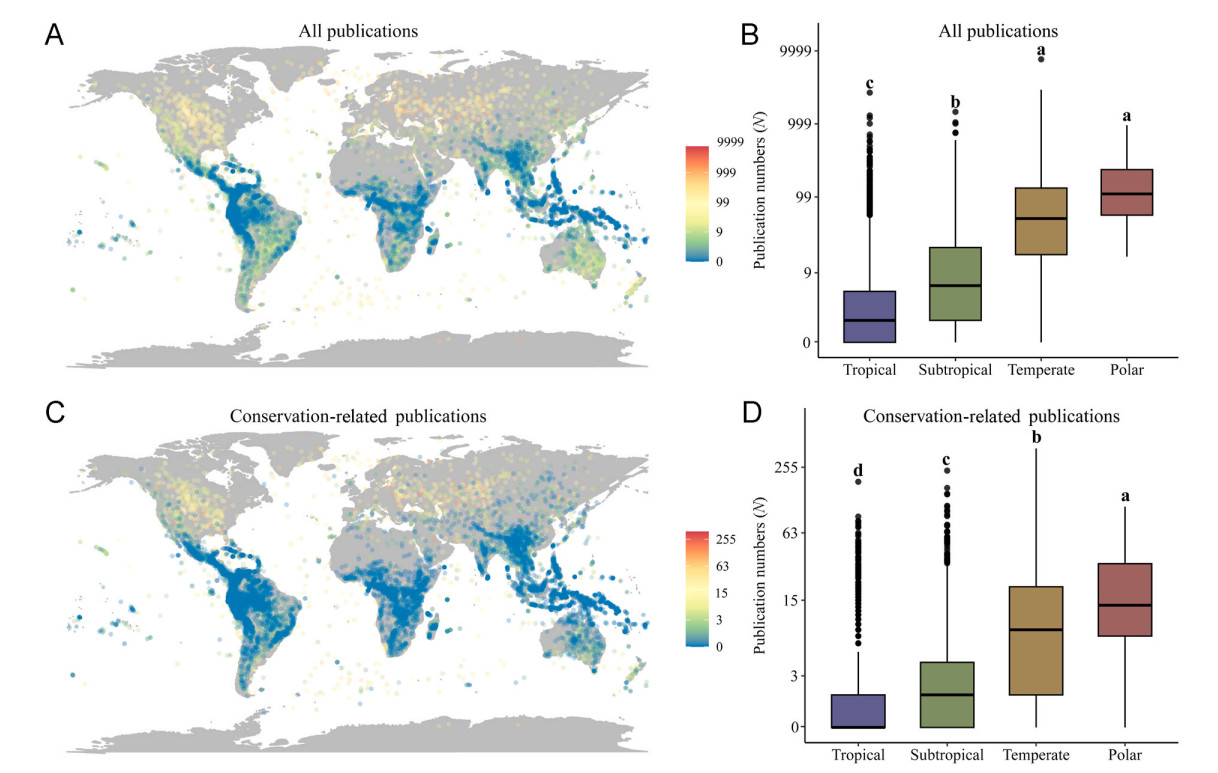
The number of publications showed strong geographic bias for both all publications (Fig. 3A) and conservation-related publications (Fig. 3C). Species distributed within climatic zones with higher latitudes had significantly higher number of publications (Fig. 3B–D). Specifically, species occurred in polar zone (66.5° N to 90° N and 66.5° S to 90° S) had the highest number of publications, while species occurred in tropical zone (23.5° S to 23.5° N) had the lowest number for both non-threatened and threatened species (Dunn's test, P < 0.001 for paired climatic zones; Fig. 3B–D).
Figure
3.
(A, C) The centroid of the species' spatial distributions and corresponding publication numbers and (B, D) boxplots and comparisons of the publication numbers for species in different climate zones. (A, B) The number of all publications. (C, D) The number of conservation-related publications. (B, D) The boxplots represented median (middle black line), 25th and 75th percentiles (box), and 1.5 × interquartile range (whiskers) of publication numbers. The same letters indicated insignificant differences and different letters indicated significant differences, with a significant level α = 0.05. Letters a to d indicated decreasing values. In order to better visualize the data, we added 1 to the original number of publications and then log-transformed (base 10 for all publications, and base 2 for conservation-related publications).
3.4
Different determinants of research effort and extinction risk
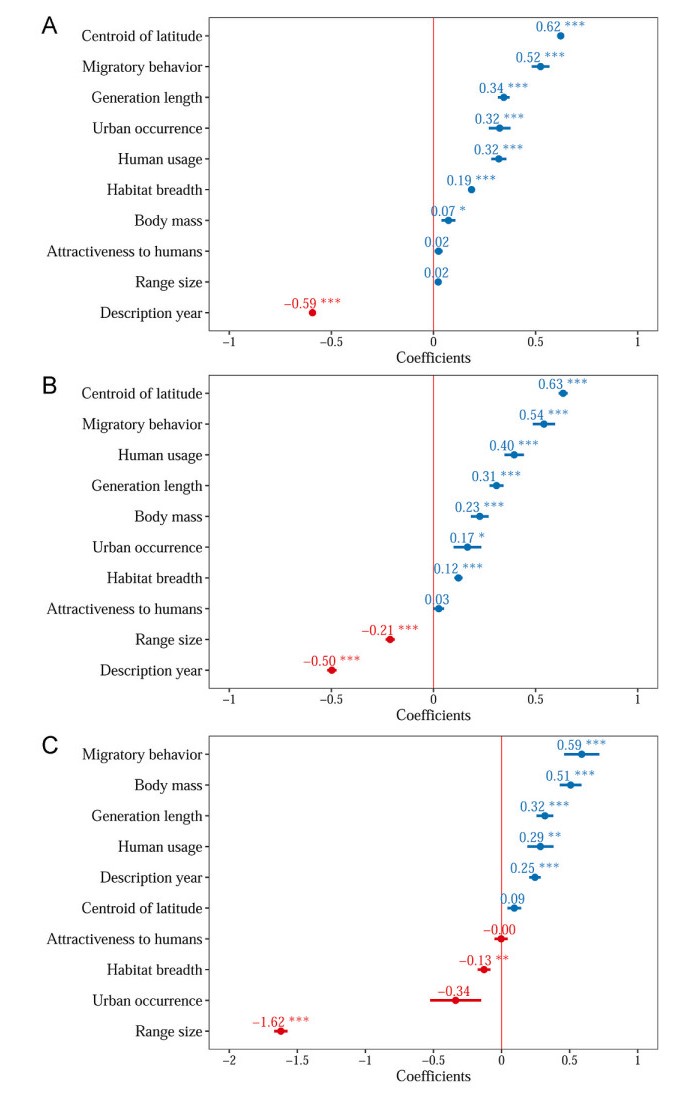
GLMM results showed that for all publications, all the eight predictors had significant influence except range size and attractiveness to human (Fig. 4A; Appendix Table S2); for conservation-related publications, all the nine predictors had significant influence except attractiveness to human (Fig. 4B; Appendix Table S2). The three most important predictors of research effort were latitude, description year and migratory behavior (Fig. 4A and B), with migratory birds described earlier and occurred at higher latitudes receiving higher research effort. Notably, species with narrow range size received lower research effort but received higher conservation-related research effort (Fig. 4A and B), indicating that narrow-ranged species were targets of conservation. The two models explained 61.8% and 51.0% of variance in all publications and conservation-related publications, respectively, with an additional 11.5% and 10.1% captured by random effects related to taxonomic relationships (Appendix Table S2).
Figure
4.
Coefficients of the predictors from the generalized linear mixed models (GLMMs) for (A) the number of all publications, (B) the number of conservation-related publications and (C) IUCN threatened status. The dots show standardized estimates of the coefficients. Blue color indicates positive effect, red color indicates negative effect. The error bars show standard errors for 95% confidence intervals of the mean parameter estimates. Significant predictors were labelled with asterisks: *P < 0.05, **P < 0.01, ***P < 0.001. (For interpretation of the references to color in this figure legend, the reader is referred to the Web version of this article.)
For IUCN threatened status, all the seven predictors had significant influence except latitude, urban occurrence, and attractiveness to human, which were all human-related predictors (Fig. 4C; Appendix Table S2). The three most important predictors of extinction risk were range size, body mass and migratory behavior (Fig. 4C), with large-sized and narrow-distributed migratory species having higher extinction risk. The model explained 55.7% of variance, with an additional 12.8% captured by random effects (Appendix Table S2).
4.
Discussion
Based on the analysis of 10,904 bird species worldwide, we found that research efforts are distributed unevenly among both threatened and non-threatened species. Fortunately, threatened species would receive higher research effort than non-threatened species, and extinction risk was positively related to research effort. However, the distribution of research effort among threatened species was highly skewed: only a few species received disproportionately higher research effort, while most threatened species still received low research effort, which may hamper their effective conservation. Our results demonstrated the extremely uneven distribution of research resources among threatened species, indicating that current conservation actions for threatened species require improvement.
4.1
Most threatened species have low research effort
The perspective that threatened species would receive more attention may result from a small proportion of threatened species receiving disproportionately high attention. In our study, the top 10 most-studied threatened species accounted for 19.6% of the total number of publications, showing strongly uneven allocation of research resources. These species received relatively high research effort mainly because of their charisma, as they are often more colorful and have large body size (Berti et al., 2020; Adamo et al., 2021). For example, the Red-crowned Crane (Grus japonensis), a large and endangered wader with conspicuous red naked skin on the top of its head, which is considered as a cultural symbol in East Asia, has been selected as flagship species in many conservation actions (Kim et al., 2021). In addition to birds, this phenomenon has also been found in other taxa. For example, primates, a charismatic group owing to its high evolutionary similarity to humans (Miralles et al., 2019), accounted for 65% of species with high quality published papers in mammals (Tam et al., 2022).
However, these charismatic species only accounted for a small proportion of threatened species, thus most threatened species lack social attention. A recent study on popular interest in vertebrates found that only 173 out of 3789 CR and EN vertebrates (4.6%) had relevant data in Google Trends, a search engine used for extracting trends in internet searches entered into Google, suggesting that only a small proportion of species receive attention on the Internet (Davies et al., 2018). Moreover, for 35 bird species listed as threatened or endangered by the U.S. Endangered Species Act, only 8.6% of them (3 species) had a median tweeting rates of higher than one tweet per hour, while the vast majority were overlooked in online social network (Roberge, 2014). Similarly, only 80 out of 1098 (7.3%) threatened mammal species were selected as flagship species by international conservation Non-Governmental Organizations (NGOs), and 61% of these campaigns only raised funds for the flagship species (Smith et al., 2012). Considering that birds and mammals are the taxa receiving the highest research effort in vertebrates (Clark and May, 2002), the status of societal extinction would be more severe in other taxa.
4.2
The reasons why many threatened species are poorly studied
Why do many threatened species have low research effort? First, our results showed that species with restricted distribution range tend to have high risk of extinction (Fig. 4B), which was consistent with previous studies (Pimm et al., 1988; Chichorro et al., 2019). Meanwhile, these species would be more difficult to be discovered and collected for specific research, thus receiving less research effort (Ducatez and Lefebvre, 2014; Ibáñez-Álamo et al., 2017; Devenish-Nelson et al., 2019). Second, species description year was positively related with species extinction risk, confirming that newly described species had higher risk of extinction than known species (Liu et al., 2022). However, more recently described species tend to have less publications owing to cumulative effect. Moreover, many newly discovered threatened species are more likely to be poached or traded (Marshall et al., 2020). To prevent poaching, taxonomists are likely to hide location information when they publish a new species (Lindenmayer and Scheele, 2017), which further decreases their research effort (Jarić et al., 2022). Third, most threatened species occurred in biodiversity hotspots in the tropics (Pimm et al., 2014), which are characterized with relatively low economic development and weak research capability (Zhang et al., 2023). In addition, collecting threatened species as research material in these regions is restricted and sometimes impossible (Scheffers et al., 2012; Guedes et al., 2023). Therefore, threatened species living in less developed tropical regions would have less related publications. At last, many threatened species are endemic to small geographic regions, and studies on these species were only reported and published in local languages (Amano et al., 2021), which are not included in the Scopus databases, leading to the underestimation of the total publications.
4.3
Implications for targeted conservation practices
Our results have important implications for biodiversity conservation, and we highlight that endemic species with narrow distribution range, newly discovered species, and threatened species in the tropics need more conservation attention because of their high risk of extinction but low research effort (Figs. 2 and 4). First, many endemic species have limited range size and population size, making them more prone to extinction as well as receiving little research effort (Harris and Pimm, 2008; Ducatez and Lefebvre, 2014). For example, the Okinawa Woodpecker (Dendrocopos noguchii), a critically endangered bird endemic to the Okinawa Prefecture of Japan with only 150 remaining individuals (Winkler et al., 2005), had only four publications in Scopus database. Second, about 60% of newly described mammal species since 1993 are cryptic species that was once considered to be a subspecies (Ceballos and Ehrlich, 2009). Similarly, the total number of bird species would reach 18,043 (almost twice the current number) under molecular and evolutionary taxonomy criteria (Barrowclough et al., 2016). For example, the number of species in the genus Scytalopus has risen from 10 in 1939 to 44 in 2020 owing to taxonomic revisions based on genetic analyses evidence (Cadena et al., 2020). Therefore, there would be many newly described species with extremely small population size and distribution range that are threatened and yet not known to humans. Third, tropics host the majority of threatened species (Pimm et al., 2014), while species living in these areas often receive low societal attention due to low economic development and weak research capability (Zhang et al., 2023). Current status of research and conservation on tropical birds desperately needs improvement. Therefore, we need to increase public awareness and willingness for conservation through publicity and education, since public support are necessary for effective conservation practices (Scott et al., 2010; Jarić et al., 2022). For example, a study found that children preferred to protect iconic and appealing exotic species rather than local ones, because exotic species were advertised more on social media, thus affecting children's willingness to protect them (Ballouard et al., 2011). In addition, more resources should be invested in training and supporting local experts to conduct specific conservation programs owing to their familiarity with endemic species and efficiency in communicating with local people (Liu et al., 2023). Our results showed that narrow distributed species were more likely to be selected as targets of conservation actions (Fig. 4B), demonstrating the importance of local conservation actions in promoting global conservation effectiveness. Moreover, we should strengthen international cooperation, providing financial and expert support to conserve endemic species in less developed countries in the hotspots of new species discovery, thus decreasing extinction risk of threatened species in these areas (Zhang et al., 2023).
Our study has several shortcomings. First, we used the number of scientific publications in Scopus database as an indicator of research effort, which was widely used in previous studies at the large spatial scales (Tam et al., 2022; Guedes et al., 2023). However, some species, especially endemic species occurred in the tropics, have been only reported and published in local languages by governments, NGOs, consultancies and private companies (Corlett, 2011; Amano et al., 2021). Meanwhile, searching such grey literature is particularly challenging in less developed countries, where governmental and NGO reports are mostly missing or not transparent (Mahood et al., 2014). Such grey literatures are not shown in Scopus database, leading to an underestimation of actual research effort. Therefore, further studies should collaborate more with local researchers from different countries and include grey literature as an additional data source to provide a more complete picture of research effort (Haddaway, 2015; Haddaway and Bayliss, 2015; Bickley et al., 2020). Second, we used the current number of publications and IUCN threatened status to represent research effort and extinction risk, respectively, while the number of publications and IUCN threatened status will change over time, which needs further exploration.
5.
Conclusion
We provide the first global assessment of both research effort and extinction risk for birds, showing that most threatened species also had low research effort. Scientific research provides the basic knowledge for developing conservation policies and actions, therefore, low research effort would hamper the effective conservation of threatened species. We also investigated determinants of research effort and extinction risk, confirming that research effort was more associated with human-related variables, while extinction risk was more associated with biological attributes. We highlight that many recently discovered and narrowly distributed species in less developed regions require more research and conservation attention. Allocating more research and conservation resources to threatened species with low research effort can help correct current conservation bias and protect biodiversity more effectively.
The authors declare that they have no known competing financial interests or personal relationships that could have appeared to influence the work reported in this paper.
Acknowledgments
We are grateful to contributors to the IUCN Red List and BirdLife International. We thank Kyle Tomlinson, Huan Fan and laboratory members for their comments and suggestions on the manuscript.
Adamo, M., Chialva, M., Calevo, J., Bertoni, F., Mammola, S., 2021. Plant scientists' research attention is skewed towards colourful, conspicuous and broadly distributed flowers. Nat. Plants 7, 574-578.
Albert, C., Luque, G.M., Courchamp, F., 2018. The twenty most charismatic species. PLoS One 13, e0199149.
Amano, T., Berdejo-Espinola, V., Christie, A.P., Willott, K., Akasaka, M., Báldi, A., et al., 2021. Tapping into non-English-language science for the conservation of global biodiversity. PLoS Biol. 19, e3001296.
Ballouard, J.-M., Brischoux, F., Bonnet, X., 2011. Children prioritize virtual exotic biodiversity over local biodiversity. PLoS One 6, e23152.
Barrowclough, G.F., Cracraft, J., Klicka, J., Zink, R.M., 2016. How many kinds of birds are there and why does it matter? PLoS One 11, e0166307.
Bartoń, K., 2024. MuMIn: Multi-Model Inference. R package version 1.48.4. .
Berti, E., Monsarrat, S., Munk, M., Jarvie, S., Svenning, J.-C., 2020. Body size is a good proxy for vertebrate charisma. Biol. Conserv. 251, 108790.
Bickley, M.S., Kousha, K., Thelwall, M., 2020. Can the impact of grey literature be assessed? An investigation of UK government publications cited by articles and books. Scientometrics 125, 1425-1444.
BirdLife International, 2020. Handbook of the Birds of the World and BirdLife
International Digital Checklist of the Birds of the World, Version 5.0. . (Accessed 18
June 2021).
Böhm, M., Williams, R., Bramhall, H.R., McMillan, K.M., Davidson, A.D., Garcia, A., et al., 2016. Correlates of extinction risk in squamate reptiles: the relative importance of biology, geography, threat and range size. Global Ecol. Biogeogr. 25, 391-405.
Bolam, F.C., Mair, L., Angelico, M., Brooks, T.M., Burgman, M., Hermes, C., et al., 2021. How many bird and mammal extinctions has recent conservation action prevented? Conserv. Lett. 14, e12762.
Brito, D., Oprea, M., 2009. Mismatch of research effort and threat in avian conservation biology. Trop. Conserv. Sci. 2, 353-362.
Brooks, M.E., Kristensen, K., Van Benthem, K.J., Magnusson, A., Berg, C.W., Nielsen, A., et al., 2017. glmmTMB balances speed and flexibility among packages for zero-inflated generalized linear mixed modeling. R J 9, 378-400.
Buechley, E.R., Santangeli, A., Girardello, M., Neate-Clegg, M.H.C., Oleyar, D., McClure, C.J.W., et al., 2019. Global raptor research and conservation priorities: tropical raptors fall prey to knowledge gaps. Divers. Distrib. 25, 856-869.
Cadena, C.D., Cuervo, A.M., Céspedes, L.N., Bravo, G.A., Krabbe, N., Schulenberg, T.S., et al., 2020. Systematics, biogeography, and diversification of Scytalopus tapaculos (Rhinocryptidae), an enigmatic radiation of Neotropical montane birds. Auk 137, ukz077.
Callaghan, C.T., Nakagawa, S., Cornwell, W.K., 2021. Global abundance estimates for 9, 700 bird species. Proc. Natl. Acad. Sci. USA 118, e2023170118.
Ceballos, G., Ehrlich, P.R., 2009. Discoveries of new mammal species and their implications for conservation and ecosystem services. Proc. Natl. Acad. Sci. USA 106, 3841-3846.
Chichorro, F., Juslén, A., Cardoso, P., 2019. A review of the relation between species traits and extinction risk. Biol. Conserv. 237, 220-229.
Clark, J.A., May, R.M., 2002. Taxonomic bias in conservation research. Science 297, 191-192.
Corlett, R.T., 2011. Trouble with the gray literature. Biotropica 43, 3-5.
Courchamp, F., Jaric, I., Albert, C., Meinard, Y., Ripple, W.J., Chapron, G., 2018. The paradoxical extinction of the most charismatic animals. PLoS Biol. 16, e2003997.
Davies, T., Cowley, A., Bennie, J., Leyshon, C., Inger, R., Carter, H., et al., 2018. Popular interest in vertebrates does not reflect extinction risk and is associated with bias in conservation investment. PLoS One 13, e0203694.
de Lima, R.F., Bird, J.P., Barlow, J., 2011. Research effort allocation and the conservation of restricted-range island bird species. Biol. Conserv. 144, 627-632.
Devenish-Nelson, E.S., Weidemann, D., Townsend, J., Nelson, H.P., 2019. Patterns in island endemic forest-dependent bird research: the Caribbean as a case-study. Biodivers. Conserv. 28, 1885-1904.
Ducatez, S., Lefebvre, L., 2014. Patterns of research effort in birds. PLoS One 9, e89955.
Ducatez, S., Sol, D., Sayol, F., Lefebvre, L., 2020. Behavioural plasticity is associated with reduced extinction risk in birds. Nat. Ecol. Evol. 4, 788-793.
Ducatez, S., Tingley, R., Shine, R., 2014. Using species co‐occurrence patterns to quantify relative habitat breadth in terrestrial vertebrates. Ecosphere 5, 152.
Fromm, A., Meiri, S., 2021. Big, flightless, insular and dead: characterising the extinct birds of the Quaternary. J. Biogeogr. 48, 2350-2359.
Fukano, Y., Tanaka, Y., Soga, M., 2020. Zoos and animated animals increase public interest in and support for threatened animals. Sci. Total Environ. 704, 135352.
Fuller, R.J., Smith, K.W., Grice, P.V., Currie, F.A., Quine, C.P., 2007. Habitat change and woodland birds in Britain: implications for management and future research. Ibis 149, 261-268.
Guedes, J.J., Moura, M.R., Diniz‐Filho, J.A.F., 2023. Species out of sight: elucidating the determinants of research effort in global reptiles. Ecography 2023, e06491.
Haddaway, N.R., 2015. The use of web-scraping software in searching for grey literature. Grey J. 11, 186-190.
Haddaway, N.R., Bayliss, H.R., 2015. Shades of grey: two forms of grey literature important for reviews in conservation. Biol. Conserv. 191, 827-829.
Harris, G., Pimm, S.L., 2008. Range size and extinction risk in forest birds. Conserv. Biol. 22, 163-171.
Ibáñez-Álamo, J.D., Rubio, E., Bitrus Zira, K., 2017. The degree of urbanization of a species affects how intensively it is studied: a global perspective. Front. Ecol. Evol. 5, 41.
IUCN, 2021. The IUCN Red List of Threatened Species. Version 2021-1. (Accessed 19
October 2021).
Jarić, I., Roll, U., Bonaiuto, M., Brook, B.W., Courchamp, F., Firth, J.A., et al., 2022. Societal extinction of species. Trends Ecol. Evol. 37, 411-419.
Jetz, W., Thomas, G.H., Joy, J.B., Redding, D.W., Hartmann, K., Mooers, A.O., 2014. Global distribution and conservation of evolutionary distinctness in birds. Curr. Biol. 24, 919-930.
Kim, J.H., Park, S., Kim, S.H., Lee, E.J., 2021. Identifying high-priority conservation areas for endangered waterbirds using a flagship species in the Korean DMZ. Ecol. Eng. 159, 106080.
Kruskal, W.H., Wallis, W.A., 1952. Use of ranks in one-criterion variance analysis. J. Am. Stat. Assoc. 47, 583-621.
Lindenmayer, D., Scheele, B., 2017. Do not publish. Science 356, 800-801.
Liu, J., Jin, X., Yao, S., Wang, Y., Lu, Y., Chen, Q., et al., 2023. Who will name new plant species? Temporal change in the origins of taxonomists in China. Proc. R. Soc. B Biol. Sci. 290, 20221954.
Liu, J., Slik, F., Zheng, S., Lindenmayer, D.B., 2022. Undescribed species have higher extinction risk than known species. Conserv. Lett. 15, e12876.
Mace, G.M., Collar, N.J., Gaston, K.J., Hilton‐Taylor, C., Akçakaya, H.R., Leader‐Williams, N., et al., 2008. Quantification of extinction risk: IUCN's system for classifying threatened species. Conserv. Biol. 22, 1424-1442.
Mahood, Q., Van Eerd, D., Irvin, E., 2014. Searching for grey literature for systematic reviews: challenges and benefits. Res. Synth. Method. 5, 221-234.
Marshall, B.M., Strine, C., Hughes, A.C., 2020. Thousands of reptile species threatened by under-regulated global trade. Nat. Commun. 11, 4738.
Mashayekhi, M., MacPherson, B., Gras, R., 2014. A machine learning approach to investigate the reasons behind species extinction. Ecol. Inform. 20, 58-66.
McKenzie, A.J., Robertson, P.A., 2015. Which species are we researching and why? A case study of the ecology of British breeding birds. PLoS One 10, e0131004.
Miralles, A., Raymond, M., Lecointre, G., 2019. Empathy and compassion toward other species decrease with evolutionary divergence time. Sci. Rep. 9, 19555.
Mongeon, P., Paul-Hus, A., 2016. The journal coverage of Web of Science and Scopus: a comparative analysis. Scientometrics 106, 213-228.
Murray, H.J., Green, E.J., Williams, D.R., Burfield, I.J., Brooke, M.D., 2015. Is research effort associated with the conservation status of European bird species? Endang. Species Res. 27, 193-206.
Muschelli, J., 2019. Rscopus: Scopus database 'API' interface. R package version 0.6.6.
.
Pimm, S.L., Jenkins, C.N., Abell, R., Brooks, T.M., Gittleman, J.L., Joppa, L.N., et al., 2014. The biodiversity of species and their rates of extinction, distribution, and protection. Science 344, 1246752.
Pimm, S.L., Jones, H.L., Diamond, J., 1988. On the risk of extinction. Am. Nat. 132, 757-785.
R Core Team, 2022. R: A Language and Environment for Statistical Computing. R
Foundation for Statistical Computing, Vienna, Austria. .
Roberge, J.-M., 2014. Using data from online social networks in conservation science: which species engage people the most on Twitter? Biodivers. Conserv. 23, 715-726.
Santangeli, A., Haukka, A., Morris, W., Arkkila, S., Delhey, K., Kempenaers, B., et al., 2023. What drives our aesthetic attraction to birds? NPJ Biodivers 2, 20.
Santos, J.W.D., Correia, R.A., Malhado, A.C.M., Campos‐Silva, J.V., Teles, D., Jepson, P., et al., 2020. Drivers of taxonomic bias in conservation research: a global analysis of terrestrial mammals. Anim. Conserv. 23, 679-688.
Scheffers, B.R., Joppa, L.N., Pimm, S.L., Laurance, W.F., 2012. What we know and don't know about Earth's missing biodiversity. Trends Ecol. Evol. 27, 501-510.
Scott, J.M., Goble, D.D., Haines, A.M., Wiens, J.A., Neel, M.C., 2010. Conservation‐reliant species and the future of conservation. Conserv. Lett. 3, 91-97.
Sitas, N., Baillie, J., Isaac, N., 2009. What are we saving? Developing a standardized approach for conservation action. Anim. Conserv. 12, 231-237.
Smith, R.J., Veríssimo, D., Isaac, N.J., Jones, K.E., 2012. Identifying Cinderella species: uncovering mammals with conservation flagship appeal. Conserv. Lett. 5, 205-212.
Stoudt, S., Goldstein, B.R., de Valpine, P., 2022. Identifying engaging bird species and traits with community science observations. Proc. Natl. Acad. Sci. USA 119, e2110156119.
Sutherland, W.J., Pullin, A.S., Dolman, P.M., Knight, T.M., 2004. The need for evidence-based conservation. Trends Ecol. Evol. 19, 305-308.
Tam, J., Lagisz, M., Cornwell, W., Nakagawa, S., 2022. Quantifying research interests in 7, 521 mammalian species with h-index: a case study. GigaScience 11, giac074.
Tilman, D., Clark, M., Williams, D.R., Kimmel, K., Polasky, S., Packer, C., 2017. Future threats to biodiversity and pathways to their prevention. Nature 546, 73-81.
Tobias, J.A., Sheard, C., Pigot, A.L., Devenish, A.J., Yang, J., Sayol, F., et al., 2022. AVONET: morphological, ecological and geographical data for all birds. Ecol. Lett. 25, 581-597.
Trimble, M.J., van Aarde, R.J., 2010. Species inequality in scientific study. Conserv. Biol. 24, 886-890.
Troudet, J., Grandcolas, P., Blin, A., Vignes-Lebbe, R., Legendre, F., 2017. Taxonomic bias in biodiversity data and societal preferences. Sci. Rep. 7, 9132.
Wang, Z.-N., Yang, L., Fan, P.-F., Zhang, L., 2021. Species bias and spillover effects in scientific research on Carnivora in China. Zool. Res. 42, 354-361.
Wilcoxon, F., 1992. Individual comparisons by ranking methods. In: Kotz, S., Johnson, A.
L. (Eds.), Breakthroughs in Statistics: Methodology and Distribution. Springer,
Berlin, pp. 196–202.
Winkler, H., Kotaka, N., Gamauf, A., Nittinger, F., Haring, E., 2005. On the phylogenetic position of the Okinawa woodpecker (Sapheopipo noguchii). J. Ornithol. 146, 103-110.
Xu, W., Viña, A., Kong, L., Pimm, S.L., Zhang, J., Yang, W., et al., 2017. Reassessing the conservation status of the giant panda using remote sensing. Nat. Ecol. Evol. 1, 1635-1638.
Zhang, L., Yang, L., Chapman, C.A., Peres, C.A., Lee, T.M., Fan, P.-F., 2023. Growing disparity in global conservation research capacity and its impact on biodiversity conservation. One Earth 6, 147-157.
Zhang, W., Goodale, E., Chen, J., 2014. How contact with nature affects children's biophilia, biophobia and conservation attitude in China. Biol. Conserv. 177, 109-116.
Table
1.
Differences of research effort biases between threatened and non-threatened species and among IUCN threatened statuses.
Comparison
Pielou's evenness indices
n1
n2
All publication numbers
TR – NO
0.813
0.790
1474
9430
LC – NT
0.799
0.618
8432
998
LC – VU
0.799
0.786
8432
792
LC – EN
0.799
0.779
8432
460
LC – CR
0.799
0.784
8432
222
NT – VU
0.618
0.786
998
792
NT – EN
0.618
0.779
998
460
NT – CR
0.618
0.784
998
222
VU – EN
0.786
0.779
792
460
VU – CR
0.786
0.784
792
222
EN – CR
0.779
0.784
460
222
Conservation-related publication numbers
TR – NO
0.882
0.869
1474
9430
LC – NT
0.875
0.787
8432
998
LC – VU
0.875
0.860
8432
792
LC – EN
0.875
0.855
8432
460
LC – CR
0.875
0.885
8432
222
NT – VU
0.787
0.860
998
792
NT – EN
0.787
0.855
998
460
NT– CR
0.787
0.885
998
222
VU – EN
0.860
0.855
792
460
VU – CR
0.860
0.885
792
222
EN – CR
0.855
0.885
460
222
Pielou’s evenness indices were calculated to measure the equitability within each status. TR – “Threatened”; NO – “non-threatened”; LC – “Least Concern”; NT – “Nearly Threatened”; VU – “Vulnerable”; EN – “Endangered”; CR – “Critically Endangered”. n1 and n2 are the number of species for the former and latter IUCN threatened status, respectively.

 DownLoad:


 Email Alerts
 RSS Feeds