Mitogenomic variation in the Black-throated Tit (Aegithalos concinnus): Conserved structure, concerted evolution of duplicate control regions and multiple distinct evolutionary lineages
Key Laboratory of Ecology of Rare and Endangered Species and Environmental Protection (Guangxi Normal University), Ministry of Education, Guilin, 541006, China
b.
Guangxi Key Laboratory of Rare and Endangered Animal Ecology, Guangxi Normal University, Guilin, 541006, China
c.
Key Laboratory of Zoological Systematics and Evolution, Institute of Zoology, Chinese Academy of Sciences, Beijing, 100101, China
Funds:
the National Natural Science Foundation of China32060310
a grant from the Department of Education of Guangxi
Key Laboratory of Ecology of Rare and Endangered Species and Environmental Protection (Guangxi Normal University), Ministry of
Education, Guilin, 541006, China.
E-mail address: daicy527@163.com (C. Dai)
The mitochondrial genome is a prominent research topic due to its indispensable role in organisms and its application in many research disciplines. However, few studies have investigated intraspecies mitogenomic variation. In this study, 69 mitogenomes of the Black-throated Tit (Aegithalos concinnus) were assembled and annotated from a large number of short reads generated using high-throughput sequencing technology. Comparative analyses revealed that mitogenomic characteristics such as length, gene and nucleotide composition, codon usage, and duplicated control regions were relatively conserved despite substantial intraspecies morphological changes. Yet, all the individuals from the subspecies A. c. iredalei had one more nucleotide in the 12S rRNA than the other studied subspecies. Phylogenetic analyses showed five distinct lineages based on the complete mitogenomes and the 13 combined protein-coding genes, whereas only four lineages were observed when using the duplicate control regions. Most interestingly, each lineage had both copies of the control regions of the comprising individuals, indicating that the paralogous control regions were more similar than the orthologous sequences from the distinct lineages. This suggested the control regions had undergone concerted evolution. The Black-throated Tit has complex evolutionary history and needs further investigating the taxonomic status of these lineages, as well as the underlying evolutionary processes. Our findings call for more research on intraspecies mitogenomic variation.
The mitochondrion, an organelle in eukaryotic cells that is thought to have originated from an endosymbiotic event, has its own genome (van Valen and Maiorana, 1980; Roger et al., 2017). In contrast to nuclear genomes, which tend to expand in size, including through an increase in the number of introns, proliferation of transposons, enlargement of intergenic regions, and duplication of genes (Lynch, 2006), the number of genes in the mitochondrion has reduced significantly along with the evolution of diverse eukaryotic lineages. Although the original ancestral bacteria of the mitochondrion had approximately 3000 genes, the mitochondrial genome now has only 37 genes in most animals, including 13 protein-coding genes, 2 rRNAs, and 22 tRNAs (Hill, 2015), as most of its original genes have been transferred into the nuclear genome.
The mitochondrion performs a wide suite of functions in eukaryotic cells (Boore, 1999; Detmer and Chan, 2007; Chong and Mueller, 2013; Ballard and Pichaud, 2014; Roger et al., 2017). However, those functions can only be achieved with the intimate and synchronized interactions between the products of the mitochondrial and nuclear genomes (Rand et al., 2004; Wolff et al., 2014) due to its unique and fascinating evolutionary history. For example, the mitochondrion is well-known as a power house that generates approximately 95% of total adenosine triphosphate (ATP) through the process of oxidative phosphorylation by the electron transport system (ETS) (Das, 2006), which is formed by five multi-subunit complexes embedded in the inner mitochondrial membrane (Saraste, 1999). The 13 mitochondrial genes encode proteins for 4 subunits of the ETS complexes (I, III, IV, and V), while more than 75 nuclear genes exclusively encode all proteins of ETS complex II and co-encode the proteins for the other 4 complexes (Burton and Barreto, 2012; Hill, 2017). There are also about 105 nuclear genes encoding non-protein products that co-function in the transcriptional, translational, and DNA replication mechanisms that enable the production of ETS proteins (Burton and Barreto, 2012). Consequently, a change in a mitogenome can trigger a cascading effect of malfunctions if the nuclear genes do not change accordingly (Hill, 2017). As such, the mitogenome is evolutionarily conserved in terms of both the order and the number of genes (Françoso et al., 2023), being a circular double-stranded molecule generally containing no introns and large intergenic spacers in animals (Wolstenholme, 1992).
However, exceptions to this exist, as gene duplication and rearrangement have been observed in various animal lineages (Macey et al., 1997; Mindell et al., 1998; Mueller and Boore, 2005; Gissi et al., 2010; Kong et al., 2020; Zardoya, 2020). For example, besides the 37 genes, the typical animal mitogenome usually contains one large non-coding control region involved in regulating and initiating mitochondrial replication and transcription, but recent studies have found duplicated control regions—as well as even more duplication with its adjacent genes—in many birds (Mackiewicz et al., 2019; Urantówka et al., 2021). The changes are more substantial in invertebrates; for example, a recent study found a whole-mitogenome duplication in two Australian Stingless Bees (Françoso et al., 2023).
Mitochondrial DNA (mtDNA) has a long history of use in studies of molecular phylogenetics, phylogeography, and species identification (e.g., DNA barcodes) (Hebert et al., 2003; Zink and Barrowclough, 2008). However, studies solely based on mitochondrial DNA have been criticized due to several well-known limitations of mtDNA, such as evidence of pervasive natural selection and the inability of maternal inheritance to capture the whole evolutionary histories of the relevant species (Edwards et al., 2005; Edwards and Bensch, 2009). Yet, in recent years, the mitonuclear compatibility species concept (Hill, 2017), which defines a species with a set of coadapted mtDNA and nuclear genes participating in ETS, argued that the mitochondrial genotype was the most efficient and best biomarker for diagnosing species (Hill, 2016, 2017, 2019). This is particularly suitable for avian species, since this evolutionary lineage has the greatest need for efficient ATP production due to its highly energy-demanding life strategies, such as higher body temperature and the movement pattern in flying (Hill, 2015, 2017). On the other hand, gene order and rearrangement can also provide phylogenetic insights, especially at higher taxonomic levels, as recent studies have indicated that these changes are likely lineage-specific (Schirtzinger et al., 2012). For example, the gene order in avian species is thought to have originated from the typical vertebrate gene order by a single duplication of a fragment ranging from nd5 to tRNA-Phe genes, and then random losses of one copy of the duplicated genes and non-coding regions in different avian lineages (Schirtzinger et al., 2012). This has resulted in the different gene composition and order appearing in distinct avian orders, families or genera (Mackiewicz et al., 2019; Urantówka et al., 2021), although an alternative opinion has been suggested (Mindell et al., 1998).
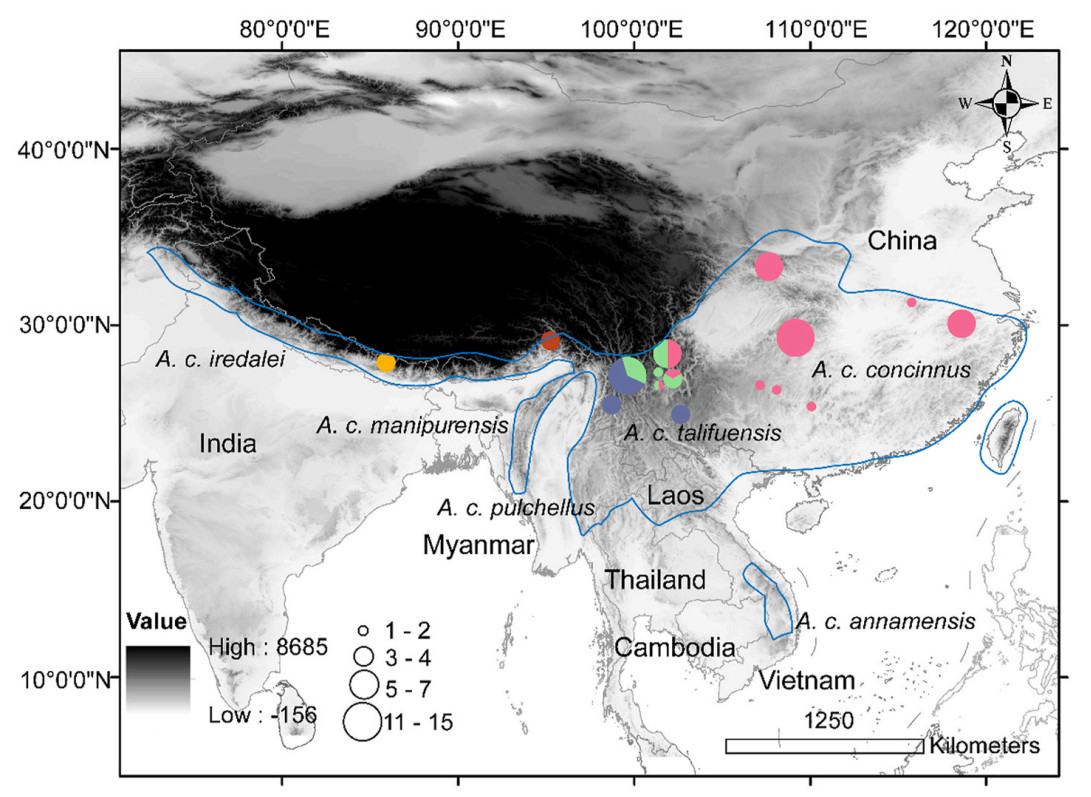
The Black-throated Tit (Aegithalos concinnus) is a small and abundant Long-tailed Tit inhabiting various vegetation types, such as pine forest, shrubs, and open broadleaf forest at mid-range altitudes (600–3200 m). It is distributed along the Himalayan foothills in Pakistan, Nepal, Bhutan, India, and Myanmar, and over much of eastern China, including Taiwan island, as well as along mountain ridges in tropical Indochina, such as in Thailand, Laos, and Vietnam (Fig. 1). An isolated population inhabits the neighboring region in southern Laos, central Vietnam, and Cambodia (Fig. 1). Although all A. concinnus share a similar pattern and arrangement of plumage, at least six subspecies (A. c. iredalei, A. c. manipurensis, A. c. talifuensis, A. c. pulchellus, A. c. concinnus, and A. c. annamensis) can be distinguished via their morphological traits, such as color differences in the crown, belly, and flank, and the color and width of the postocular lines. Moreover, analyses have found that genetic divergence is remarkable not only among subspecies, but also within some subspecies when evaluated with mtDNA (Päckert et al., 2010; Dai et al., 2011, 2017). Most interestingly, the Pygmy Tit (Psaltria exilis) was found to be more closely related than a lineage predominately comprising the nominate subspecies to the other subspecies of the Black-throated Tit (Johansson et al., 2016).
Figure
1.
Distribution and sampling locations of the Black-throated Tit. The different colors in circles represent the identified lineages. (For interpretation of the references to color in this figure legend, the reader is referred to the Web version of this article.)
Recently, complete mitogenomes have been reported for one bird each from the subspecies A. c. talifuensis and A. c. concinnus, in which duplications were observed; that is, two control regions existed within each bird (Wang et al., 2015a). The two paralogous control regions are not equal in length, and the majority of sequences are similar and thought to be under concerted evolution. Concerted evolution is defined as the situation in which paralogous genes or sequences within a species are more similar than the orthologous ones between species (Liao, 1999; Ogoh and Ohmiya, 2007; Morris-Pocock et al., 2010; Li et al., 2015a; Shi et al., 2020). The duplicated control regions have been regarded to increase the copy number and expression of mitochondrial genes (Kumazawa et al., 1996) and therefore to meet energy requirements (Eberhard and Wright, 2016). However, as only two individuals were sequenced in that report (Wang et al., 2015a), whether the observed pattern occurred at individual, population, or species level is unclear since the control region has been recorded as the most variable area in the avian mitogenome (Sammler et al., 2013). For example, the pattern of tandem repeats varies sharply in the control region of the Yellow-brown Tit (Sylviparus modestus) (Wang et al., 2015b). Moreover, as has been mentioned before, the genetic divergence between and even within some subspecies (such as in A. c. talifuensis and A. c. iredalei) is notable, and occurs to an extent comparable with that between independent species (Päckert et al., 2010). This further raises the very interesting question of whether the observed gene rearrangement is the case for the other unanalyzed A. concinnus subspecies, and whether the pattern of concerted evolution proposed for the duplicated control regions is applicable with respect to the multiple deeply split lineages.
Thanks to the unremitting efforts of software developers, it is now possible to obtain complete mitogenomes from the high-throughput short reads generated by next-generation sequencing technology. In this study, we assembled complete mitogenome of the Black-throated Tit from short reads available in GenBank, and then carried out a comparative and phylogenetic analysis to elucidate this species' mitogenomic characteristics in a phylogeographic context. As such, the specific aims of this study were as follows: 1) to detect the intraspecific mitogenomic variation in view of the sharp divergence both in genetics and morphology within the species; 2) to elucidate whether the divergence revealed by a partial mitochondrial sequence can be confirmed by the complete mitogenome; 3) to observe whether the duplicated control regions are indeed evolved in concerted evolution in terms of the different subspecies or divergent lineages.
2.
Material and methods
2.1
Samples
The short reads generated by next-generation sequencing technology were downloaded from GenBank, with a total of 70 individuals represented. These samples covered three subspecies distributed in mainland China, of which seven individuals were A. c. iredalei, 30 A. c. talifuensis, and 33 A. c. concinnus. The sampling locations are shown in Fig. 1. The short reads of two individuals of Aegithalos iouschistos were also downloaded and used as the outgroups in the phylogenetic analyses. The accession numbers were SRR10467124 to SRR10467170, SRR15193483 to SRR15193500, and SRR15193502 to SRR15193509.
2.2
Mitogenome assembly and annotation
The program GetOrganelle 1.7.6 (Jin et al., 2020) was used to assemble the mitogenomes. The assembling command used was the program developers' recommended recipe, which was slightly modified in some cases to use the whole available short reads for assembly. Only one sample from A. c. iredalei failed to be assembled as a completed circular sequence, and it was therefore excluded from subsequent analyses. The assembled mitogenomes were annotated with MitoZ 3.6 (Meng et al., 2019).
2.3
Comparative mitogenome analyses
The nucleotide composition of each mitogenomic sequence was calculated, while nucleotide composition bias was estimated using the following formulae: AT-skew = [A – T]/[A + T] and GC-skew = [G – C]/[G + C]. The 13 protein-coding genes were extracted and then the codon usage, relative synonymous codon usage (RSCU), and nucleotide composition for the 1st, 2nd, 3rd, and all three codon positions for the combined sequences were calculated. The rRNAs, tRNAs, and control regions were also extracted, and their nucleotide compositions and nucleotide composition biases were calculated. All these calculations were carried out using the PhyloSuite v1.2.3 program (Zhang et al., 2020; Xiang et al., 2023).
2.4
Phylogenetic analyses
Three datasets were used for phylogenetic analyses: the complete mitogenomic sequences, the merged sequence of 13 protein-coding genes, and the sequences of the duplicated control regions. For the former two datasets, outgroups were used. All the datasets were aligned using the MAFFT (Rozewicki et al., 2019) plugin with the L-INS-I algorithm, as implemented in PhyloSuite (Zhang et al., 2020; Xiang et al., 2023). Phylogenetic trees were constructed using both maximum likelihood (ML) and Bayesian inference (BI). Maximum likelihood phylogenies were inferred using IQ-TREE (Minh et al., 2020) under the partition schemes, while the best-fit models were determined by ModelFinder (Kalyaanamoorthy et al., 2017) using the corrected Akaike information criterion (AICc). Node support was evaluated using 1000 ultrafast bootstrap replicates. Bayesian inference phylogenies were inferred using MrBayes (Ling et al., 2015) with two independent runs, each with four Markov chain Monte Carlo chains (one cold) for 5,000,000 generations, with sampling every 1000 generations. The first 25% of the runs were discarded as burn-in prior to estimating posterior probabilities for branch support. The best-fit partitioning schemes and substitution models were determined using PartitionFinder (Lanfear et al., 2012) via the "greedy" algorithm, with branch lengths estimated as "linked, " and AICc. Convergence was assessed as the standard deviation of split frequencies < 0.01. All these analyses were carried out in PhyloSuite with the corresponding plugins.
The alignable sequences of the duplicated control regions were extracted with the Gblock (Castresana, 2000) plugin, with the default settings implemented in PhyloSuite (Zhang et al., 2020; Xiang et al., 2023). Then the phylogenetic trees were constructed by ML and BI as mentioned above for the other two datasets. Phylogenetic analyses were also carried out using a dataset in which a few nucleotides unique to each copy were further trimmed both at the beginning and end of the alignable sequence, with a length of 1048 bp.
2.5
Levels of divergence between lineages
Kimura 2-parameter distances among mitochondrial lineages defined by phylogenetic analyses were computed based on the complete mitogenome and the combined sequences of the 13 protein-coding genes in MEGA X (Kumar et al., 2018).
3.
Results
3.1
Mitogenome structure and nucleotide composition
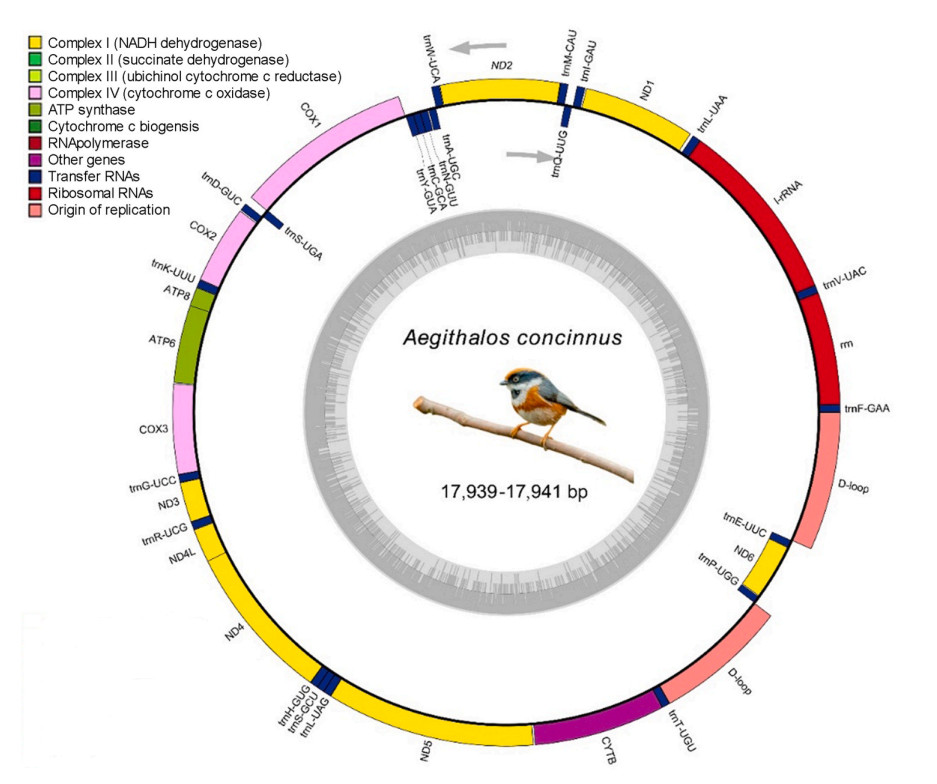
The lengths of the complete mitogenomic sequences ranged from 17,939 to 17,941 bp (Table 1 and Appendix A), without subspecies-specific clustering in length. The mitogenome structures for all the individuals were identical and comprised 37 genes, including 13 protein-coding genes, 2 rRNA genes, 22 tRNA genes, and 2 control regions (Fig. 2). Most genes, including 12 protein-coding genes, 14 tRNAs, and 2 rRNAs, as well as the 2 control regions, were on the H-strand, while one protein-coding gene (nd6) and 8 tRNAs (trnA, trnC, trnE, trnN, trnP, trnQ, trnS2, and trnY) were encoded on the L-strand (Fig. 2). The proportions of nucleotide composition were as follows: A = 29.56 ± 0.05% (range: 29.5–29.6%), T = 24.95 ± 0.15% (range: 24.8–25.2%), G = 14.38 ± 0.04% (range: 14.3–14.4%), C = 31.12 ± 0.14% (range: 30.8–31.2%) (Table 1). The AT content (mean: 54.51 ± 0.12%, range: 54.3–54.9%) was substantially higher than that of GC (45.5 ± 0.13%, range: 45.1–45.6%). The overall AT skew and GC skew ranged from 0.078 to 0.089, with a mean of 0.085, and from −0.371 to −0.362, with a mean of −0.368, respectively (Table 1).
Table
1.
Nucleotide composition and skew values for the Black-throated Tit.
The total length of protein-coding genes for each individual was identical, at 11,394 bp (Table 1). All protein-coding genes initiated strictly with ATG as the start codon, except for nd3, which initiated with an ATA codon. However, stop codons varied among genes, with TAA being the most prevalent. Seven genes (cox2, atp6, atp8, nd2, nd3, cytb, and nd4L) ended with TAA, whereas three genes (cox1, nd1, and nd6) ended with AGG, and nd5 ended with AGA. The incomplete stop TA was present in cox3, while T appeared in nd4. The genes atp8 and atp6 shared 10 nucleotides, while nd4L and nd4 overlapped by 7 nucleotides. The total number of codons in the protein-coding genes was 3787. Codons encoding Cys were the rarest (0.77 ± 0.004%), while those encoding Leu1 occurred most frequently (15.95 ± 0.09%) (Appendix B). Overall, the five most abundant codons were CUA (310.46 ± 3.25), AUC (201 ± 3.38), UUC (162.88 ± 5.2), CUC (155.81 ± 4.54), and GCC (142.75 ± 1.06), while CUA had the highest RSCU value (2.81 ± 0.03), followed by CGA (2.17 ± 0.04) and GAA (1.89 ± 0.04). The proportions of nucleotide composition of the combined protein-coding gene sequence were 28.16 ± 0.07% for A, 25.6 ± 0.2% for T, 14.05 ± 0.06% for G, and 32.2 ± 0.19% for C. The AT content (53.75 ± 0.14%) was higher than that of GC (46.25 ± 0.15%) (Table 1). AT skew and GC skew were 0.047 ± 0.004 and −0.392 ± 0.005, respectively (Table 1). The proportions of nucleotide composition for the 1st codon position were 27.900 ± 0.030% for A, 19.969 ± 0.110% for T, 23.184 ± 0.037% for G, and 28.954 ± 0.099% for C, whereas AT content, AT skew, and GC skew were 47.869 ± 0.127%, 0.165 ± 0.002, and −0.111 ± 0.002, respectively. The proportions of nucleotide composition for the 2nd codon position were 18.566 ± 0.057% for A, 40.112 ± 0.033% for T, 12.833 ± 0.056% for G, and 28.490 ± 0.031% for C, whereas AT content, AT skew, and GC skew were 58.678 ± 0.067%, −0.368 ± 0.001, and −0.377 ± 0.001, respectively. The proportions of nucleotide composition for the 3rd codon position were 38.013 ± 0.167% for A, 16.667 ± 0.496% for T, 6.118 ± 0.119% for G, and 39.201 ± 0.436% for C, whereas AT content, AT skew, and GC skew were 54.681 ± 0.355%, 0.391 ± 0.014, and −0.730 ± 0.007, respectively.
The 12S rRNA gene was 979 bp long for most individuals, with an average AT content of 51.63 ± 0.10% (Table 1). However, in all six individuals from the subspecies A. c. iredalei, it was 980 bp long. The 16S rRNA gene was 1601 bp in length for all samples, with an AT content of 55.91 ± 0.10% (Table 1). The total length of tRNAs was 1545 bp, with each tRNA gene ranging in size from 66 bp (trnS1) to 75 bp (trnL2). The AT content of the 22 tRNAs was 57.88 ± 0.20% (Table 1). All the tRNA genes showed the expected cloverleaf secondary structures with normal base pairing, including trnS1, which does not have the entire dihydrouridine arm in most metazoan mitogenomes.
Two larger non-coding control regions (CR1 and CR2) were located between trnE and trnF, of 1157–1158 bp in length (CR1), and between trnT and trnP, of 1205–1207 bp (CR2) in length (Table 1). The base composition of CR1 was 24.34 ± 0.25% for A, 31.38 ± 0.15% for T, 14.08 ± 0.31% for G, and 30.21 ± 0.22% for C (Table 1). The AT content (55.71 ± 0.30%) was higher than the GC content (44.29 ± 0.30%) in CR1. The base composition of CR2 was 25.67 ± 0.25% for A, 31.04 ± 0.17% for T, 13.34 ± 0.21% for G, and 29.96 ± 0.25% for C, and the AT content (56.71 ± 0.33%) was higher than GC content (43.29 ± 0.33%) (Table 1).
3.2
Phylogenetic analyses
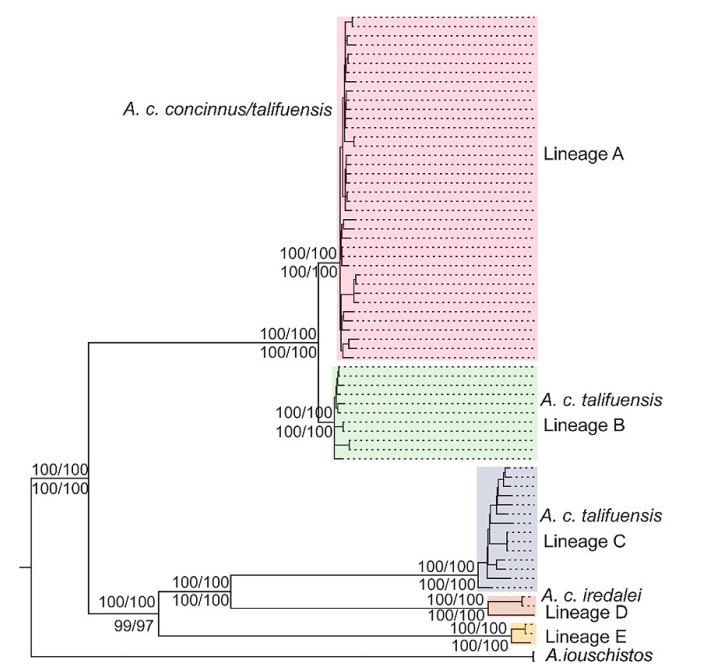
A congruent phylogenetic tree with five distinct lineages was reconstructed within the sampled Black-throated Tit data based on the complete mitogenomes and the combined sequences of 13 protein-coding genes, as well as by using the different BI and ML methods (Fig. 3). The supporting values of the divergent nodes were very high. The birds formed two major clades, in which one clade was composed of the individuals from the nominate subspecies and a few from A. c. talifuensis, and the other clade consisted of the majority of A. c. talifuensis and all the A. c. iredalei. The former clade further split into two lineages, of which one lineage consisted exclusively of the broadly distributed nominate A. c. concinnus (lineage A) while the other was composed of individuals of both subspecies, but with a rather limited distribution (lineage B). The clade consisting of A. c. talifuensis and A. c. iredalei further diverged into three lineages, in which the A. c. talifuensis (lineage C) is sister lineage to the eastern A. c. iredalei (lineage D), whereas the western A. c. iredalei (lineage E) occupied the basal position of the clade and was sister to the group comprising A. c. talifuensis and the eastern A. c. iredalei.
Figure
3.
The five lineages of the Black-throated Tit identified in the phylogenetic analyses. Supporting values are denoted by numbers on the branches for the Bayesian inference tree, and below the branches for the maximum likelihood tree based on the complete mitogenomes and 13 protein-coding genes, respectively.
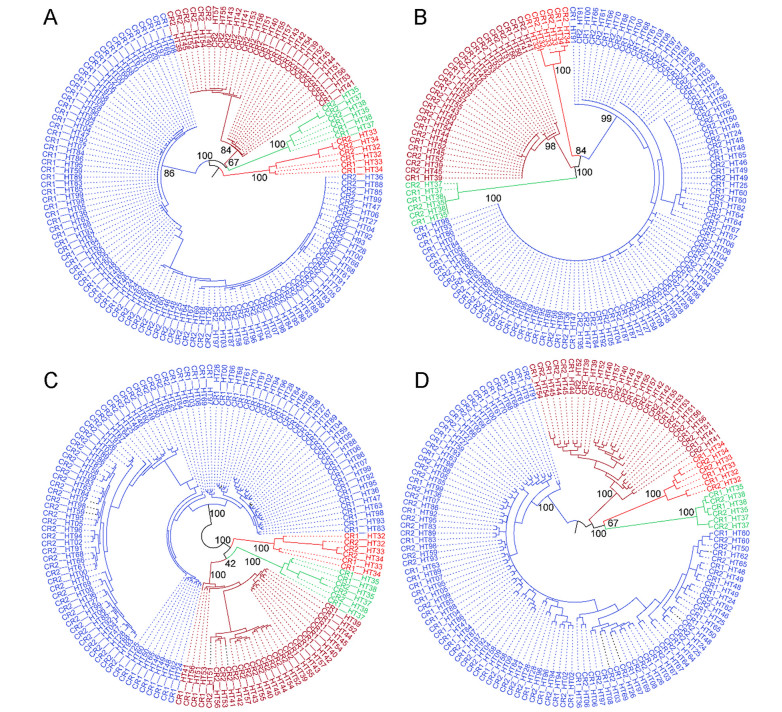
The BI phylogenetic tree constructed by the alignable duplicated CR sequences was slightly different from the above-mentioned trees. It also had two clades, but split into only four lineages (Fig. 4C). The clade consisting of all the individuals from the nominate subspecies and a few from A. c. talifuensis (lineages A and B) was collapsed into one lineage. The other clade had the same three lineages, in which the comprising individuals and the relationships among the lineages were consistent with those identified using the other two datasets. In contrast, although ML inference also identified the same four lineages, the relationships among those lineages had substantially changed in the ML phylogeny. For example, one lineage from the subspecies A. c. iredalei (lineage D) was sister to the lineage consisting of A. c. talifuensis (lineage C), and their sister group was the lineage composed of the individuals from the nominate subspecies and a few from A. c. talifuensis (the collapsed lineage A and B), whereas another lineage from the subspecies A. c. iredalei (lineage E) was located at the basal position (Fig. 4A). Although the supporting values for each lineage were very high, the relationships among these lineages were not well supported in both phylogenetic trees. Within each lineage, orthologous control regions usually clustered as separate groups. Interestingly, when using the further-trimmed alignment with 1048 bp, most of the paralogous control regions of the same individuals were clustered as a sister pair (Fig. 4B and D).
Figure
4.
Results of the phylogenetic analyses of the alignable regions of the duplicated control regions (A and C) and the further trimmed 1048-bp alignment (B and D). A and B were constructed using maximum likelihood, and C and D using Bayesian inference.
The genetic distances among the lineages identified in the phylogenetic analyses ranged from 0.0046 to 0.0453 based on the complete mitogenomes. However, only one pair had a value of 0.0046, whereas the others had values higher than 0.037. The values of genetic distance were slightly higher when computed with the 13 protein-coding gene sequences, which ranged from 0.0056 to 0.0595. Similarly, only one pair had a value of 0.0056, and the other pairs had values higher than 0.04. Details are listed in Table 2.
Table
2.
Kimura 2-parameter distance among the identified lineages.
Lineage
A
B
C
D
E
A
0.0056
0.0548
0.0588
0.0585
B
0.0046
0.0541
0.0584
0.0575
C
0.0409
0.0408
0.0495
0.0595
D
0.0453
0.0452
0.0378
0.0588
E
0.0451
0.0442
0.0451
0.0461
Upper right are the distances computed based on 13 protein-coding gene sequences, whereas the lower left are the distances computed based on complete mitogenome sequences.
Currently, the mitogenome is a popular research topic due to its key functional role in organisms and its application in many research disciplines (Li et al., 2015b; Sun et al., 2020a, 2020b). However, the majority of studies have reported the mitogenome structure, and its associated phylogenetic implications of one or only a few species (Li et al., 2015b; Shi et al., 2020, 2023; Sun et al., 2020a, 2020b; Yang et al., 2023). While a few studies have indeed investigated the mitogenomic variation within a species, they generally paid attention to the genetic divergence and its applications within the species but not to the mitogenome itself (Johnsen et al., 2017; Fields et al., 2018; Lait et al., 2018; Lombardo et al., 2022; Lubbe et al., 2022). This study represents the first to investigate the differences in mitogenomic characteristics within a species characterized by morphologically distinct composing members, and found two interesting outcomes.
Firstly, the total length of the mitogenome of the Black-throated Tit is relatively conserved, with only a 3-bp variation, as are other characteristics such as nucleotide composition, AT content, and codon usages. The length of the previously reported mitogenomes compiled via Sanger sequencing technology fall into the length range of this study (Wang et al., 2015a), indicating that the mitogenomes assembled from the short reads were accurate. This is understandable, as the avian mitogenome is selectively conserved and compact, meaning that larger changes may occur only in the non-coding region. In the Black-throated Tit, the non-coding regions do not show much length variation. Although the differences between the two paralogous control regions ranged from 50 to 53 bp within an individual, the differences between the orthologous control regions were minor between individuals. This differs from the findings of a previous study that revealed extreme variation in the length of the orthologous control regions within species; for example, the length of the control region varied from 1374 bp to 1609 bp in the Yellow-browed Tit (Wang et al., 2015b). However, the Yellow-browed Tit has one control region, while the Black-throated Tit has duplicated control regions. Due to few complete intraspecies mitogenomes being available at present, whether this is the underlying reason for the length change of the control region is unclear and could be tested in future.
Secondly, although almost all the mitochondrial genes were of identical length among the sampled individuals, interestingly, six individuals exhibited a difference in length at the 12S rRNA gene. All these six birds were from the subspecies A. c. iredalei, with a 980-bp 12S rRNA gene, while the other individuals had lengths of 979 bp. This additional site was not located at the same position, but at two different locations. This precludes the possibility of this difference arising from sequencing or assembling errors. As such, this result indicates that a change in gene length can occur within a species. Such change has never been reported in Aves before, which highlights the necessity of conducting comparative mitogenomic analyses within species, especially for those exhibiting notable changes in morphology.
4.2
Duplicated control regions
While many avian species have one control region, two control regions have been observed in the Black-throated Tit. The control region contains the initiation site of mitogenome replication and transcription (Shadel and Clayton, 1997), and the maintenance of two control regions is most likely a result of the functionality of both regions. Otherwise, the non-functional copy would degenerate and eventually be lost due to the selectively compact nature of the avian mitogenome to maintain optimal coding efficiency and replication rate. An additional control region could be one more location for the initiation of transcription and replication, which could increase both the copy number and expression of mitochondrial genes, making mitogenomes with duplicated control regions selectively advantageous (Kumazawa et al., 1996). Mitogenomes with two control regions would begin replicating at a faster rate than those with only one control region if the replication of the mitogenome were to start simultaneously at both control regions (Shao et al., 2005). Moreover, two control regions have been regarded to provide efficient and simultaneous replication and transcription from multiple loci to meet energy requirements (Eberhard and Wright, 2016).
The Black-throated Tit is a small bird weighing 4.8–8.0 g (Li et al., 1982), and moves very actively through vegetation. During the wintering periods, it usually flocks in a foraging group of medium-to-large size (approximately 8–20 individuals or even more) that searches for food on trees one by one, spanning a large region with each search (Personal observations). In the breeding season, on the other hand, feeding activity is extremely energy-intensive due to a much larger clutch size, generally ranging from five to eight (usually seven) eggs (Li et al., 2012; Lv et al., 2023). It has been reported that the number of nestling-feeding activities performed by a breeding pair was as high as 303 in one diurnal day (Li et al., 1982). In addition, except for the nominate subspecies, the other Black-throated Tit subspecies almost exclusively live in mountainous regions at medium-to-high altitudes. This may imply a high energy requirement for maintaining the species' survival and life activities. Therefore, two functional control regions would be selectively favored in this bird.
Previous studies have indicated that the two functional copies of control regions can undergo concerted or independent evolution in animals (Li et al., 2015a; Liao, 1999; Ogoh and Ohmiya, 2007; Tatarenkov and Avise, 2007), where concerted evolution is that where the sequence similarity between the paralogous copies within species is much smaller than that between the orthologous copies from different species (Morris-Pocock et al., 2010; Akiyama et al., 2017). A previous study found that the relationship between paralogous and orthologous control regions was dependent on the nucleotide portion used in the Black-throated Tit (Wang et al., 2015a). If using all the alignable nucleotides, the orthologous and paralogous copies were clustered respectively, while the paralogous copies of an individual clustered when a few variable nucleotides at the beginning and end of the alignment were excluded (Wang et al., 2015a). Therefore, the authors suggested that some portion of the control regions evolved via independent evolution, while others had undergone concerted evolution (Wang et al., 2015a).
In the present study, the phylogeny based on the alignable control regions had four highly supported lineages. Each lineage contained both copies of the control regions for the individuals involved. Such a phylogeny indicates the paralogous control regions are more similar than the orthologous sequences from distinct lineages, highlighting that the duplicated control regions evolved in concert. The pattern became more evident in the phylogeny constructed after a few nucleotides unique to each copy were excluded both at the beginning and end of the alignment, in which the paralogous sequences of an individual were closely related and clustered together in most of the birds. This finding is slightly different from that of the previously mentioned study (Wang et al., 2015a), highlighting the importance of including more individuals within a species in the analysis.
4.3
Evolutionary lineage
The use of the complete mitogenome and the combined protein-coding sequences revealed an identical phylogenetic constitution, with five highly supported lineages within the sampled Black-throated Tits in spite of only three subspecies being analyzed. Such a notable genetic divergence in this species has been reported in previous studies. For example, the uncorrected p-distance was found to range from 4.3% between the two lineages within the subspecies A. c. iredalei to 5.9% between the subspecies A. c. manipurensis and A. c. concinnus based on a partial sequence of the cytb gene (Päckert et al., 2010), whereas genetic distance of as high as 4.8% was reported within the subspecies A. c. talifuensis based on three mitochondrial protein-coding genes (Dai et al., 2011). The current study therefore confirms these previous findings, which could indicate the coexistence of several distinct evolutionary lineages and a complex demographical history for the Black-throated Tit. However, it is worth noting that the phylogenetic analyses using the duplicated control regions showed only four lineages. The two lineages identified with multiple genes or the complete mitogenome collapsed into one lineage because of the shallow divergence, with a genetic distance of no more than 1% (Dai et al., 2011).
Within this context, the taxonomic status of these deeply divergent lineages and their underlying evolutionary processes merit further investigation. Unfortunately, a phylogenetic analysis involving all the subspecies is absent due to the difficulty in obtaining high-quality samples, as some are distributed in politically unstable Southeast Asian countries. Yet interesting findings have been reported in recent years. For example, a multilocus phylogenetic study showed that the Black-throated Tit has diverged into two major evolutionary groups, in which the Pygmy Tit was nested in and closely related to one group of this species (Johansson et al., 2016). However, a later multilocus genetic analysis revealed the absence of reproductive isolation between the two non-sister and deeply diverged lineages, since individuals sampled at the contact zone were almost identified as F2 hybrids (Dai et al., 2017).
Although the mitonuclear compatibility species concept strongly suggested that mitochondrial genotype could be used to diagnose species (Hill, 2015, 2016, 2017, 2019), the actual situation should be elucidated or further confirmed by using more data, such as nuclear genome data and samples covering all subspecies and a wide distribution. In addition, the random breeding between the two non-sister and deeply diverged lineages merits further investigation, as it may represent a case of historical mitogenome introgression from an extinct species (Zhang et al., 2019). Moreover, this lineage pair is also a good system for testing the hypothesis of mitonuclear compatibility; for example, by answering whether differences exist in the nuclear genomes, and whether the functions of these divergent nuclear regions are linked to the mitochondrion (Morales et al., 2018).
5.
Conclusions
This study represents the first to investigate the differences in mitogenomic characteristics within a species characterized by morphologically distinct composing members and notable genetic divergence. It has been observed that mitogenomic characteristics such as length, gene and nucleotide composition, codon usage, and duplicated control regions were relatively conserved. However, the length of 12S rRNA exhibited subspecies-specific changes. Both the complete mitogenomes and the 13 combined protein-coding genes showed 5 distinct lineages, indicating its complex evolutionary history and the need for further investigating the taxonomic status of these lineages, as well as the underlying evolutionary processes. The duplicated control regions may be selectively favored to meet the high energy requirements of this species and evolve in concert. These peculiar findings call for more research on intraspecies mitogenomic variations.
The authors declare that they have no known competing financial interests or personal relationships that could have appeared to influence the work reported in this paper.
Acknowledgements
We are grateful to two anonymous reviewers for their valuable comments, which have significantly improved this manuscript.
Akiyama, T., Nishida, C., Momose, K., Onuma, M., Takami, K., Masuda, R., 2017. Gene duplication and concerted evolution of mitochondrial DNA in crane species. Mol. Phylogenet. Evol. 106, 158-163.
Ballard, J.W.O., Pichaud, N., 2014. Mitochondrial DNA: more than an evolutionary bystander. Funct. Ecol. 28, 218-231.
Burton, R.S., Barreto, F.S., 2012. A disproportionate role for mt DNA in Dobzhansky–Muller incompatibilities? Mol. Ecol. 21, 4942-4957.
Castresana, J., 2000. Selection of conserved blocks from multiple alignments for their use in phylogenetic analysis. Mol. Biol. Evol. 17, 540-552.
Chong, R.A., Mueller, R.L., 2013. Low metabolic rates in salamanders are correlated with weak selective constraints on mitochondrial genes. Evolution 67, 894-899.
Dai, C., Hao, Y., He, Y., Lei, F., 2017. The absence of reproductive isolation between non-sister and deeply diverged mitochondrial lineages of the black-throated tit (Aegithalos concinnus) revealed by a multilocus genetic analysis in a contact zone. BMC Evol. Biol. 17, 266.
Dai, C., Zhao, N., Wang, W., Lin, C., Gao, B., Yang, X., et al., 2011. Profound climatic effects on two East Asian black-throated tits (Aves: aegithalidae), revealed by ecological niche models and phylogeographic analysis. PLoS One 6, e29329.
Das, J., 2006. The role of mitochondrial respiration in physiological and evolutionary adaptation. Bioessays 28, 890-901.
Detmer, S.A., Chan, D.C., 2007. Functions and dysfunctions of mitochondrial dynamics. Nat. Rev. Mol. Cell Biol. 8, 870-879.
Eberhard, J.R., Wright, T.F., 2016. Rearrangement and evolution of mitochondrial genomes in parrots. Mol. Phylogenet. Evol. 94, 34-46.
Edwards, S., Bensch, S., 2009. Looking forwards or looking backwards in avian phylogeography? A comment on Zink and Barrowclough 2008. Mol. Ecol. 18, 2930-2936.
Edwards, S.V., Kingan, S.B., Calkins, J.D., Balakrishnan, C.N., Jennings, W.B., Swanson, W.J., et al., 2005. Speciation in birds: genes, geography, and sexual selection. P. Natl. Acad. Sci. USA 102, 6550-6557.
Fields, P.D., Obbard, D.J., McTaggart, S.J., Galimov, Y., Little, T.J., Ebert, D., 2018. Mitogenome phylogeographic analysis of a planktonic crustacean. Mol. Phylogenet. Evol. 129, 138-148.
Françoso, E., Zuntini, A.R., Ricardo, P.C., Santos, P.K.F., de Souza Araujo, N., Silva, J.P.N., et al., 2023. Rapid evolution, rearrangements and whole mitogenome duplication in the Australian stingless bees Tetragonula (Hymenoptera: Apidae): a steppingstone towards understanding mitochondrial function and evolution. Int. J. Biol. Macromol. 242, 124568.
Hebert, P.D., Cywinska, A., Ball, S.L., DeWaard, J.R., 2003. Biological identifications through DNA barcodes. Proc. R. Soc. Biol. Sci. Ser. B 270, 313-321.
Hill, G.E., 2015. Mitonuclear ecology. Mol. Biol. Evol. 32, 1917-1927.
Hill, G.E., 2016. Mitonuclear coevolution as the genesis of speciation and the mitochondrial DNA barcode gap. Ecol. Evol. 6, 5831-5842.
Hill, G.E., 2017. The mitonuclear compatibility species concept. Auk 134, 393-409.
Hill, G.E., 2019. Reconciling the mitonuclear compatibility species concept with rampant mitochondrial introgression. Integr. Comp. Biol. 59, 912-924.
Jin, J., Yu, W., Yang, J., Song, Y., DePamphilis, C.W., Yi, T., et al., 2020. GetOrganelle: a fast and versatile toolkit for accurate de novo assembly of organelle genomes. Genome Biol. 21, 241.
Johansson, U.S., Ericson, P.G., Fjeldså, J., Irestedt, M., 2016. The phylogenetic position of the world's smallest passerine, the Pygmy Bushtit Psaltria exilis. Ibis 158, 519-529.
Johnsen, A., Kearns, A.M., Omland, K.E., Anmarkrud, J.A., 2017. Sequencing of the complete mitochondrial genome of the common raven Corvus corax (Aves: Corvidae) confirms mitogenome-wide deep lineages and a paraphyletic relationship with the Chihuahuan raven C. cryptoleucus. PLoS One 12, e0187316.
Kalyaanamoorthy, S., Minh, B.Q., Wong, T.K., Von Haeseler, A., Jermiin, L.S., 2017. ModelFinder: fast model selection for accurate phylogenetic estimates. Nat. Methods 14, 587-589.
Kong, L., Li, Y., Kocot, K.M., Yang, Y., Qi, L., Li, Q., et al., 2020. Mitogenomics reveals phylogenetic relationships of Arcoida (Mollusca, Bivalvia) and multiple independent expansions and contractions in mitochondrial genome size. Mol. Phylogenet. Evol. 150, 106857.
Kumar, S., Stecher, G., Li, M., Knyaz, C., Tamura, K., 2018. Mega X: molecular evolutionary genetics analysis across computing platforms. Mol. Biol. Evol. 35, 1547-1549.
Kumazawa, Y., Ota, H., Nishida, M., Ozawa, T., 1996. Gene rearrangements in snake mitochondrial genomes: highly concerted evolution of control-region-like sequences duplicated and inserted into a tRNA gene cluster. Mol. Biol. Evol. 13, 1242-1254.
Lait, L.A., Marshall, H.D., Carr, S.M., 2018. Phylogeographic mitogenomics of Atlantic cod Gadus morhua: variation in and among trans-Atlantic, trans-Laurentian, Northern cod, and landlocked fjord populations. Ecol. Evol. 8, 6420-6437.
Lanfear, R., Calcott, B., Ho, S.Y., Guindon, S., 2012. PartitionFinder: combined selection of partitioning schemes and substitution models for phylogenetic analyses. Mol. Biol. Evol. 29, 1695-1701.
Li, D.-H., Shi, W., Munroe, T.A., Gong, L., Kong, X.-Y., 2015. Concerted evolution of duplicate control regions in the mitochondria of species of the flatfish family Bothidae (Teleostei: Pleuronectiformes). PLoS One 10, e0134580.
Li, J., Lv, L., Wang, Y., Xi, B., Zhang, Z., 2012. Breeding biology of two sympatric Aegithalos tits with helpers at the nest. J. Ornithol. 153, 273-283.
Li, X., Huang, Y., Lei, F., 2015. Comparative mitochondrial genomics and phylogenetic relationships of the Crossoptilon species (Phasianidae, Galliformes). BMC Genom. 16, 42.
Liao, D., 1999. Concerted evolution: molecular mechanism and biological implications. Am. J. Hum. Genet. 64, 24-30.
Ling, C., Hamada, T., Gao, J., Zhao, G., Sun, D., Shi, W., 2015. MrBayes tgMC 3++: a high performance and resource-efficient GPU-oriented phylogenetic analysis method. IEEE ACM Trans. Comput. Biol. Bioinf 13, 845-854.
Lombardo, G., Rambaldi Migliore, N., Colombo, G., Capodiferro, M.R., Formenti, G., Caprioli, M., et al., 2022. The mitogenome relationships and phylogeography of barn swallows (Hirundo rustica). Mol. Biol. Evol. 39, msac113.
Lubbe, P., Rawlence, N.J., Kardailsky, O., Robertson, B.C., Day, R., Knapp, M., et al., 2022. Mitogenomes resolve the phylogeography and divergence times within the endemic New Zealand Callaeidae (Aves: Passerida). Zool. J. Linn. Soc. 196, 1451-1463.
Lv, Q., Hu, Y., Wen, L., Xu, P., Wang, J., Li, J., 2023. Does research activity affect nest survival of birds? A case study on the black-throated tit (Aegithalos concinnus). Biodivers. Sci. 31, 22570.
Lynch, M., 2006. The origins of eukaryotic gene structure. Mol. Biol. Evol. 23, 450-468.
Macey, J.R., Larson, A., Ananjeva, N.B., Fang, Z., Papenfuss, T.J., 1997. Two novel gene orders and the role of light-strand replication in rearrangement of the vertebrate mitochondrial genome. Mol. Biol. Evol. 14, 91-104.
Mackiewicz, P., Urantówka, A.D., Kroczak, A., Mackiewicz, D., 2019. Resolving phylogenetic relationships within Passeriformes based on mitochondrial genes and inferring the evolution of their mitogenomes in terms of duplications. Genome Biol. Evol. 11, 2824-2849.
Meng, G., Li, Y., Yang, C., Liu, S., 2019. MitoZ: a toolkit for animal mitochondrial genome assembly, annotation and visualization. Nucleic Acids Res. 47.
Mindell, D.P., Sorenson, M.D., Dimcheff, D.E., 1998. Multiple independent origins of mitochondrial gene order in birds. P. Natl. Acad. Sci. USA 95, 10693-10697.
Minh, B.Q., Schmidt, H.A., Chernomor, O., Schrempf, D., Woodhams, M.D., Von Haeseler, A., et al., 2020. IQ-TREE 2: new models and efficient methods for phylogenetic inference in the genomic era. Mol. Biol. Evol. 37, 1530-1534.
Morales, H.E., Pavlova, A., Amos, N., Major, R., Kilian, A., Greening, C., et al., 2018. Concordant divergence of mitogenomes and a mitonuclear gene cluster in bird lineages inhabiting different climates. Nat. Ecol. Evol. 2, 1258-1267.
Morris-Pocock, J.A., Taylor, S.A., Birt, T.P., Friesen, V.L., 2010. Concerted evolution of duplicated mitochondrial control regions in three related seabird species. BMC Evol. Biol. 10, 14.
Mueller, R.L., Boore, J.L., 2005. Molecular mechanisms of extensive mitochondrial gene rearrangement in plethodontid salamanders. Mol. Biol. Evol. 22, 2104-2112.
Ogoh, K., Ohmiya, Y., 2007. Concerted evolution of duplicated control regions within an ostracod mitochondrial genome. Mol. Biol. Evol. 24, 74-78.
Päckert, M., Martens, J., Sun, Y.-H., 2010. Phylogeny of long-tailed tits and allies inferred from mitochondrial and nuclear markers (Aves: Passeriformes, Aegithalidae). Mol. Phylogenet. Evol. 55, 952-967.
Rand, D.M., Haney, R.A., Fry, A.J., 2004. Cytonuclear coevolution: the genomics of cooperation. Trends Ecol. Evol. 19, 645-653.
Roger, A.J., Muñoz-Gómez, S.A., Kamikawa, R., 2017. The origin and diversification of mitochondria. Curr. Biol. 27, R1177-R1192.
Rozewicki, J., Li, S., Amada, K.M., Standley, D.M., Katoh, K., 2019. MAFFT-DASH: integrated protein sequence and structural alignment. Nucleic Acids Res. 47, W5-W10.
Sammler, S., Ketmaier, V., Havenstein, K., Tiedemann, R., 2013. Intraspecific rearrangement of duplicated mitochondrial control regions in the luzon tarictic hornbill Penelopides manillae (Aves: Bucerotidae). J. Mol. Evol. 77, 199-205.
Saraste, M., 1999. Oxidative phosphorylation at the fin de siecle. Science 283, 1488-1493.
Schirtzinger, E.E., Tavares, E.S., Gonzales, L.A., Eberhard, J.R., Miyaki, C.Y., Sanchez, J.J., et al., 2012. Multiple independent origins of mitochondrial control region duplications in the order Psittaciformes. Mol. Phylogenet. Evol. 64, 342-356.
Shadel, G.S., Clayton, D.A., 1997. Mitochondrial DNA maintenance in vertebrates. Annu. Rev. Biochem. 66, 409-435.
Shao, R., Barker, S.C., Mitani, H., Aoki, Y., Fukunaga, M., 2005. Evolution of duplicate control regions in the mitochondrial genomes of metazoa: a case study with Australasian Ixodes ticks. Mol. Biol. Evol. 22, 620-629.
Shi, F., Yu, T., Xu, Y., Zhang, S., Niu, Y., Ge, S., et al., 2023. Comparative mitochondrial genomic analysis provides new insights into the evolution of the subfamily Lamiinae (Coleoptera: Cerambycidae). Int. J. Biol. Macromol. 225, 634-647.
Shi, W., Gong, L., Yu, H., 2020. Double control regions of some flatfish mitogenomes evolve in a concerted manner. Int. J. Biol. Macromol. 142, 11-17.
Sun, C.-H., Liu, H.-Y., Lu, C.-H., 2020. Five new mitogenomes of Phylloscopus (Passeriformes, Phylloscopidae): sequence, structure, and phylogenetic analyses. Int. J. Biol. Macromol. 146, 638-647.
Sun, C.-H., Liu, H.-Y., Min, X., Lu, C.-H., 2020. Mitogenome of the little owl Athene noctua and phylogenetic analysis of Strigidae. Int. J. Biol. Macromol. 151, 924-931.
Tatarenkov, A., Avise, J.C., 2007. Rapid concerted evolution in animal mitochondrial DNA. Proc. R. Soc. Biol. Sci. Ser. B 274, 1795-1798.
Urantówka, A.D., Kroczak, A., Strzała, T., Zaniewicz, G., Kurkowski, M., Mackiewicz, P., 2021. Mitogenomes of Accipitriformes and Cathartiformes were subjected to ancestral and recent duplications followed by gradual degeneration. Genome Biol. Evol. 13, evab193.
Van Valen, L.M., Maiorana, V.C., 1980. The archaebacteria and eukaryotic origins. Nature 287, 248-250.
Wang, X., Huang, Y., Liu, N., Yang, J., Lei, F., 2015. Seven complete mitochondrial genome sequences of bushtits (Passeriformes, Aegithalidae, Aegithalos): the evolution pattern in duplicated control regions. Mitochondrial DNA 26, 350-356.
Wang, X., Liu, N., Zhang, H., Yang, X.-J., Huang, Y., Lei, F., 2015. Extreme variation in patterns of tandem repeats in mitochondrial control region of yellow-browed tits (Sylviparus modestus, Paridae). Sci. Rep. 5, 13227.
Wolff, J.N., Ladoukakis, E.D., Enríquez, J.A., Dowling, D.K., 2014. Mitonuclear interactions: evolutionary consequences over multiple biological scales. Philos. Trans. R. Soc. B 369, 20130443.
Xiang, C.Y., Gao, F., Jakovlić, I., Lei, H.P., Hu, Y., Zhang, H., et al., 2023. Using PhyloSuite for molecular phylogeny and tree-based analyses. iMeta 2, e87.
Yang, C., Dong, X., Wang, Q., Hou, X., Yuan, H., Li, X., 2023. Mitochondrial genome characteristics of six Phylloscopus species and their phylogenetic implication. PeerJ 11, e16233.
Zardoya, R., 2020. Recent advances in understanding mitochondrial genome diversity. F1000Res 9, F1000.
Zhang, D., Gao, F., Jakovlić, I., Zou, H., Zhang, J., Li, W.X., et al., 2020. PhyloSuite: an integrated and scalable desktop platform for streamlined molecular sequence data management and evolutionary phylogenetics studies. Mol. Ecol. Resour. 20, 348-355.
Zhang, D., Tang, L., Cheng, Y., Hao, Y., Xiong, Y., Song, G., et al., 2019. "Ghost introgression" as a cause of deep mitochondrial divergence in a bird species complex. Mol. Biol. Evol. 36, 2375-2386.
Zink, R.M., Barrowclough, G.F., 2008. Mitochondrial DNA under siege in avian phylogeography. Mol. Ecol. 17, 2107-2121.
Table
2.
Kimura 2-parameter distance among the identified lineages.
Lineage
A
B
C
D
E
A
0.0056
0.0548
0.0588
0.0585
B
0.0046
0.0541
0.0584
0.0575
C
0.0409
0.0408
0.0495
0.0595
D
0.0453
0.0452
0.0378
0.0588
E
0.0451
0.0442
0.0451
0.0461
Upper right are the distances computed based on 13 protein-coding gene sequences, whereas the lower left are the distances computed based on complete mitogenome sequences.

 DownLoad:


 Email Alerts
 RSS Feeds