Lin Sun, Chunhong Liang, Shidi Qin, Ying Zhu, Ke He. 2024: Exploring the interplay of T cell receptor-V gene copy numbers and major histocompatibility complex selection pressure in avian species: Insights into immune system evolution and reproductive investment. Avian Research, 15(1): 100204. DOI: 10.1016/j.avrs.2024.100204
Citation:
Lin Sun, Chunhong Liang, Shidi Qin, Ying Zhu, Ke He. 2024: Exploring the interplay of T cell receptor-V gene copy numbers and major histocompatibility complex selection pressure in avian species: Insights into immune system evolution and reproductive investment. Avian Research, 15(1): 100204. DOI: 10.1016/j.avrs.2024.100204
Lin Sun, Chunhong Liang, Shidi Qin, Ying Zhu, Ke He. 2024: Exploring the interplay of T cell receptor-V gene copy numbers and major histocompatibility complex selection pressure in avian species: Insights into immune system evolution and reproductive investment. Avian Research, 15(1): 100204. DOI: 10.1016/j.avrs.2024.100204
Citation:
Lin Sun, Chunhong Liang, Shidi Qin, Ying Zhu, Ke He. 2024: Exploring the interplay of T cell receptor-V gene copy numbers and major histocompatibility complex selection pressure in avian species: Insights into immune system evolution and reproductive investment. Avian Research, 15(1): 100204. DOI: 10.1016/j.avrs.2024.100204
Exploring the interplay of T cell receptor-V gene copy numbers and major histocompatibility complex selection pressure in avian species: Insights into immune system evolution and reproductive investment
College of Animal Science and Technology, College of Veterinary Medicine, Zhejiang Agriculture and Forestry University, Key Laboratory of Applied Technology on Green-Eco-Healthy Animal Husbandry of Zhejiang Province, Zhejiang, 311300, China
b.
Institute of Qinghai-Tibetan Plateau, Southwest Minzu University, Sichuan, 610000, China
Funds:
the “Pioneer” and “Leading Goose” R&D Program of Zhejiang2022C04014
Zhejiang Science and Technology Major Program on Agricultural New Variety Breeding2021C02068-10
Birds, a fascinating and diverse group occupying various habitats worldwide, exhibit a wide range of life-history traits, reproductive methods, and migratory behaviors, all of which influence their immune systems. The association between major histocompatibility complex (MHC) genes and certain ecological factors in response to pathogen selection has been extensively studied; however, the role of the co-working molecule T cell receptor (TCR) remains poorly understood. This study aimed to analyze the copy numbers of TCR-V genes, the selection pressure (ω value) on MHC genes using available genomic data, and their potential ecological correlates across 93 species from 13 orders. The study was conducted using the publicly available genome data of birds. Our findings suggested that phylogeny influences the variability in TCR-V gene copy numbers and MHC selection pressure. The phylogenetic generalized least squares regression model revealed that TCR-Vαδ copy number and MHC-I selection pressure were positively associated with body mass. Clutch size was correlated with MHC selection pressure, and Migration was correlated with TCR-Vβ copy number. Further analyses revealed that the TCR-Vβ copy number was positively correlated with MHC-ⅡB selection pressure, while the TCR-Vγ copy number was negatively correlated with MHC-I peptide-binding region selection pressure. Our findings suggest that TCR-V diversity is significant in adaptive evolution and is related to species’ life-history strategies and immunological defenses and provide valuable insights into the mechanisms underlying TCR-V gene duplication and MHC selection in avian species.
Animals use various mechanisms to effectively respond to pathogen challenges and maintain their immune capacity (Saino et al., 2004; Cichoń and Dubiec, 2005). Describing the state of wild animals in an ecologically relevant and physiologically sound manner is crucial for understanding the delicate balance between the animal immune system and other costly functions, such as reproduction and growth (Tieleman, 2018). Obtaining a comprehensive understanding of immune function and life history is complicated by the abundant indices in qualifying and quantifying the immune system of wild animals (as mentioned above). The T cell receptor-major histocompatibility complex (TCR-MHC) complex significantly facilitates an effective adaptive cell-mediated immune response and is an ideal model for quantifying immune function in animals (Shah et al., 2021). T cell activation to recognize and respond to pathogenic antigens is a vital step in TCR-MHC-related immunity. Pathogen recognition is influenced by the highly diverse MHC allele repertoire and the diverse repertoire of TCRs generated through variable/diversity/joining (V/D/J) gene rearrangements. MHC molecules are essential in the process of T cell negative selection, where they present self-peptides to gauge T cell tolerance and eliminate T cells that may elicit autoimmune reactions (Irla, 2022). Evidence suggests that auto-reactivity could impede the evolutionary expansion of MHC Class I genes (Migalska et al., 2019). The arms race between hosts and pathogens has caused marked polymorphism of MHC genes at the population level; however, studies on TCR diversity are currently primarily limited to human diseases and other model species (Anonymity, 2023; Früh et al., 2024), and the co-evolution of these genes remains unstudied in phylogeny.
During T-cell development, the αβTCR and γδTCR chains contain V, D, J, and constant (C) gene regions (Davis and Bjorkman, 1988). The V gene repertoire, resulting from TCR gene duplication, combined with distinct V classes, V-J (or V-D-J) pairing, and Complementarity Determining Region 3 (CDR3) diversity, contributes to various TCR possibilities. This can result in approximately 106 TCRβ chains in the human blood (Arstila et al., 1999). Human studies revealed that TCR clonality and similarity metrics may be correlated with the clinical signs and symptoms in patients with lung cancer (Yang et al., 2021). More importantly, in the evolutionary process, selection pressure and evolution may influence the varying number of V gene copies required to combat environmental pathogens, an event that remains understudied.
In this study, we focused on birds, a diverse group in various habitats across different geographical locations. Birds exhibit distinct mating systems involving complex behaviors, such as mate choice and cooperative breeding. Additionally, they display various social behaviors, including group migration, cooperative foraging, communal roosting, parent-offspring interactions, coordinated group defenses, and elaborate territorial and courtship rituals (Podos and Webster, 2022). These social behaviors result in varying possibilities of pathogen transmission. Bird migration significantly influences immune system challenges (Bush and Clayton, 2018; Rogers et al., 2022). Furthermore, birds have diverse diets, and scavenging vultures with different feeding habits undergo a more significant immune gene evolution than other birds do (Zou et al., 2021). The rich ecological diversity of birds, their extensive evolutionary history, and their fascinating migratory behavior provide a comprehensive perspective for studying the immune system within this group.
To date, investigations on TCR architecture and genetic diversity in avian species have primarily focused on a few economically significant species, such as Chicken (Gallus gallus) (Liu et al., 2020) and Duck (Anas platyrhynchos) (Yang et al., 2017), and model species, such as Zebra Finch (Poephla guttata) (Parra and Miller, 2012), and previous research had used high-throughput sequencing to analyze TCRβ and TCRγ V diversity in chickens (Zhang et al., 2020). In our previous study, we classified V genes into 16 groups (3 Vα, 3 Vδ, 4 Vβ, and 6 Vγ) (Liang et al., 2023) and found that the local chicken breeds expressed few but highly diverse Vα and Vβ groups (Liang et al., 2024). However, the copy number of the V genes in avian species remains unknown.
Previous studies have explored the copy number of MHC genes in birds (Minias et al., 2019), which is reportedly associated with lifespan and migration behavior (Minias et al., 2017, 2019), and coloniality is believed to be associated with MHC Class I gene diversity (O'Connor et al., 2018). However, the genetic diversity of the population depends on gene copy numbers and polymorphism, which can be reflected by the selection pressure. Several life-history traits, such as body weight, body length, and weaning age, influence the dN/dS ratios of 1550 genes across marsupial phylogenies (Luzuriaga-Neira and Alvarez-Ponce, 2022). Functional sites in or surrounding the peptide-binding region (PBR) of MHC genes are reportedly crucial for adaptive evolution (Vinkler et al., 2023). Therefore, in this study, in contrast to previous investigations, we incorporated the influence of selection pressure on MHC genes to examine the co-evolution dynamics between MHC and ecological factors to address this question from a novel perspective.
Diverse antigens may require a more diverse TCR repertoire for recognition, causing increased TCR copy numbers. TCR recognition of antigens depends on MHC presentation, and the environment may directly or indirectly influence MHC selection pressure by affecting TCR copy numbers. Therefore, we focused on TCR copy numbers and MHC selection pressure as our immune gene research targets. Combined with several related ecological factors, we investigated the relationship between copy numbers of potentially functional TCR-V genes and MHC selection pressure, as well as the mechanisms influenced by ecological factors. We aimed to explore: (1) whether the process of TCR-V gene duplication in birds is associated with MHC selective pressure; (2) the potential critical ecological factors related to TCR-V copy numbers and MHC selective pressure; and (3) the potential co-evolutionary relationships among immune genes under the influence of vital ecological factors.
2.
Materials and methods
2.1
Compilation of avian Third-generation sequencing (TGS) genome data
Publicly available genome data of birds were obtained from the National Center for Biotechnology Information (NCBI, https://www.ncbi.nlm.nih.gov/, Bethesda, MD, USA) and the China National GeneBank DataBase (CNGBdb, China) (accessed on April 2, 2023). Only long-read TGS data were used in this study. When there were duplicated versions of the genome data for a species, we considered the assembly level (Chromosome > Scaffold > Contig) for processing. We selected orders with more than three species with available genome data to ensure a comprehensive representation of each evolutionary clade. After applying these filters, 90 species belonging to 10 orders were included in the analysis. Additionally, we incorporated four orders (Casuariiformes, Columbiformes, Cathartiformes, and Pteroclidiformes) with only one species genome data owing to their unique evolutionary status. Consequently, our study included 93 species belonging to 14 orders. Detailed information on each genome assembly is provided in Appendix Table S1.
2.2
Identification of the TCR-V copy number
We used the algorithms developed in our previous study (Liang et al., 2023) to establish a phylogenetic-based classification for TCR-V genes of avian species, such as chicken, duck, and Zebra Finch, using the available sequence data. These sequences were clustered into groups based on 70% amino acid similarity, and one representative sequence per group was used as queries in tBLASTn (sequences are listed in Appendix Table S2). TCR-V gene prediction was conducted via three steps (Liang et al., 2023). First, the TCR-C and TCR-V genes were predicted using tBLASTn with e-values < 1e–5, and only the predicted TCR-V genes within the same contigs or scaffolds as the predicted TCR-C genes were selected. Second, potentially functional or pseudo-V genes were identified based on IMGT standards (IMGT, http://www.imgt.org) (Robinson et al., 2013). Pseudogenes were defined as V genes with frameshifts, truncations, in-frame stop codons, or incorrect initiation codons. Third, recombination signal sequences (RSS) for the V elements were determined using the RSS database (https://www.itb.cnr.it/rss/analyze.html) (Merelli et al., 2010). The predicted TCR-V genes lacking Rss23 were also excluded.
The V, J, and C genes of TCRα and TCRδ are within the TRAD region. TCRα and TCRδ share some V genes. Therefore, we can infer the copy numbers of the V genes in the TRAD region collectively and refer to them as Vαδ. Notably, Vαδ2 mentioned in the subsequent text is not on the same contig as the classical Vαδ; however, it is independently expressed along with another gene called TRD2. Furthermore, in the species examined in this study, the V genes mostly belonged to the same group (Vδ1), which closely clustered with VHδ. TCR-V copy numbers were compared between Passeriformes and non-Passeriformes using a nonparametric testing method known as the Wilcoxon test (implemented through the “wilcox.test” function in R). The Kruskal–Wallis test was used to compare orders.
Scaffold N50 is a crucial metric for evaluating the quality of genome assembly and provides insights into the continuity and integrity of the assembly process (Gurevich et al., 2013). To assess the potential impact of genome assembly quality on our TCR copy number analysis, we performed a Pearson's correlation analysis and phylogenetic linear regression between TCR copy numbers and genome N50. This analysis revealed no significant correlation between these two variables, suggesting that the observed TCR copy number variations are not significantly influenced by the quality of the genome assemblies. Similarly, we queried the assembly levels of the genomes (Chromosome, Scaffold, and Contig) and conducted separate analyses for genomes with different assembly levels using Pearson's test. All calculations mentioned above were conducted using R (version 4.3.1, 2023-06-16).
2.3
Generation of ancestral MHC peptide-binding sequence and calculation of selection pressure for each species
We conducted a comprehensive search and identified the predicted complete loci of classical MHC sequences using previously described methods (He et al., 2020). Only the complete loci containing three exons (2–4) were further analyzed, as they provided sufficient available data. The database comprised sequences from exons associated with peptide binding (Exons 2, 3 (of MHC-I), and 3 (of MHC-ⅡB)), which were used for subsequent analyses. Following the establishment of the MHC sequence database, we determined the ancestral sequence of the bird MHC using the available data following these steps. First, the sequences were aligned using Geneious v.2022.1.1 software (Biomatters Ltd., Auckland, New Zealand) and were manually adjusted. Additionally, we included some sequences exhibiting the widespread occurrence of a two-amino acid deletion in MHC-I Exon 3. Second, phylogenetic trees were constructed using MrBayes3.2.0, with Ambystoma mexicanum as an outgroup species reference point. Third, FITMG94 and AnsestralSequence tools in the Hyphy software (Pond et al., 2005) were used to generate ancestral sequences for MHC-I Exons 2 and 3 and MHC-ⅡB Exon 3 (Appendix Table S2).
Subsequently, the selective pressure for each species was determined using sequence analysis. Functional sequences from our database were aligned with the corresponding ancestral sequences, and ω values were calculated using the Ka/Ks calculator tool in TBTools (Chen et al., 2020). Next, the weighted average ω values were calculated for each species based on the ω values obtained from all sequences. Only one representative sequence was selected when identical sequences were in the species dataset. This analysis was performed across the entire exon and within the PBR region, yielding six sets of values: whole-exon ω values and PBR-specific ω values for MHC-I Exons 2 (ω-whole-I2 and ω-PBR-I2) and 3 (ω-whole-I3 and ω-PBR-I3) and MHC-ⅡB Exon 2 (ω-whole-ⅡB and ω-PBR-ⅡB). We conducted a Kruskal–Wallis test to assess the differences in MHC selection pressures across different avian orders.
2.4
Establishment of the ecological factor database
The ecological factor database was primarily sourced from Avonet (Tobias et al., 2022), followed by the Birds of the World website (http://birdsoftheworld.org). We further supplemented this database with information from ADW (http://animaldiversity.org). Our comprehensive database encompasses various parameters, including: 1) body mass (g); 2) trophic level; 3) habitat; 4) social behavior; 5) mating system; 6) centroid latitude; 7) migration; 8) parental care; 9) condition at hatching; 10) cooperative breeding; 11) clutch size; 12) life span; 13) incubation period; 14) range size; and 15) habitat density. Detailed information is provided in Appendix Table S3.
2.5
Statistical analyses
2.5.1
Detection of phylogenetic signals for ecological factors
First, we analyzed the correlations among the 15 ecological factors. These variables were categorized as continuous or non-continuous. For continuous ecological factors, we performed Pearson's correlation analysis, while for non-continuous factors, we used the Kruskal–Wallis tests. The correlation analysis suggested seven factors (incubation period, life span, centroid latitude, habitat, condition at hatching, trophic level, and habitat density) were excluded owing to their strong correlations with others (P < 0.05, Appendix Table S4).
Subsequently, we conducted phylogenetic signal detection of the remaining ecological factors. The phylogenetic signal was estimated using Pagel's λ (Pagel, 1997) for continuous variables and calculated using “phytools” in R. For non-continuous variables, only binary variable types were considered and analyzed using the phylogenetic signal D value computed with the “phylo.d” function in the “caper” package (Orme et al., 2013). The results are listed in Table 1. Comparisons of TCR-V copy numbers among orders indicated a phylogenetic signal in the habitat (Kruskal–Wallis test, P = 0.0022). Among the remaining eight factors, only social behavior (D value = 0.6892, P > 0.05) and range size (λ value < 0.001, P > 0.05) did not exhibit a significant phylogenetic signal. Therefore, it was excluded from the model analysis. The six remaining ecological factors showed strong phylogenetic signals (P < 0.05), indicating the need for phylogenetic correction in our model.
Table
1.
Phylogenetic signals (Pagel's λ/D values) of the selected ecological factors.
After conducting phylogenetic signal analysis, we included six ecological factors (body mass, clutch size, migration, cooperative breeding, mating system, and parental care) in the subsequent phylogenetic model analysis.
2.5.2
Preformation of phylogenetic generalized least square (PGLS) analyses
Furthermore, we investigated the relationship among the TCR-V copy numbers, MHC selection pressure, and ecological factors. We used the PGLS model for statistical analysis to determine the influence of phylogenetic relationships on the environmental variables. This approach minimized biases and improved our understanding of correlations and co-adaptation during the evolutionary process. Phylogenetic trees for the species were constructed using the Ericson sequences on the VertLife webserver (http://vertlife.org). A substantial sample of 1000 tree files was exported to ensure tree conservation and subsequently imported into Geneious for the derivation of a concise consensus tree, which was utilized in subsequent analyses.
First, in the analysis of the relationship between TCR-V copy numbers and ecological factors, we considered ecological factors as independent variables and the copy numbers of the four TCR-V genes as a constant entity. The copy numbers of Vαδ, Vβ, and Vγ were included in the analysis (excluding Vαδ2 because of its low variability among birds). Six ecological factors with phylogenetic signals were included as dependent variables in the PGLS model analysis. All continuous variables were logarithmically transformed. At a significance level of P < 0.1 (to cover all possible factors), our results indicated that social behavior, mating system, parental care, and cooperative breeding had no significant effect on the copy number variations of these three V genes (Table 2). Finally, after thoroughly analyzing multiple factors, we investigated the relationship between body mass, clutch size, migration, and TR-V gene copy numbers.
Table
2.
Results of the PGLS model predicting the influence of environmental ecological factors on TCR-V gene copy number.
Subsequently, we investigated the relationship between TCR-V gene copy numbers and MHC selection pressure, using MHC selection pressure as an independent variable and TCR-V gene copies as dependent variables (because TCR function relies on MHC antigen presentation).
Third, we examined the correlation between MHC selection pressure and the four ecological factors mentioned above, using the former as the independent variable and ecological factors as the dependent variable. The relationship between assembly levels of the genomes (Chromosome, Scaffold, and Contig) and TCR-V copy number was also evaluated with the PGLS model.
We obtained t-values and P-values from the output of the PGLS model. Among the categorical environmental variables, we identified the type with the highest absolute |t| value indicating a stronger association. The P-values represented the statistical significance of the relationships. The PGLS model was computed using the “caper” package in R.
2.5.3
Investigation of the relationship between environmental factors and immune-related genes using the redundancy analysis (RDA) model
RDA was used to further investigate the influence of ecological factors on immune-related genes. We included V gene copy number and MHC selection pressure as response variables and three ecological variables (body mass, clutch size, and migration) as explanatory variables. Because the mutual recognition presented by MHC is primarily recognized by αδTCR, we excluded TCR-Vγ when we explored the relationship between TCR-V copy number and MHC selection pressure. We applied Helinger transformation to the explanatory variables (environmental factors) and log transformation to the response variables (V gene copy number and MHC selection pressure). Similarly, we investigated collinearity among all variables using the variance inflation factor to establish independence. Subsequently, we performed variance decomposition and hierarchical partitioning using the “UpSetVP” package in R to gain a more comprehensive understanding of the sources and contributions of explained variability in the RDA model for the dependent variable(s).
3.
Results
3.1
Variable copy numbers of the TCR-V genes in birds
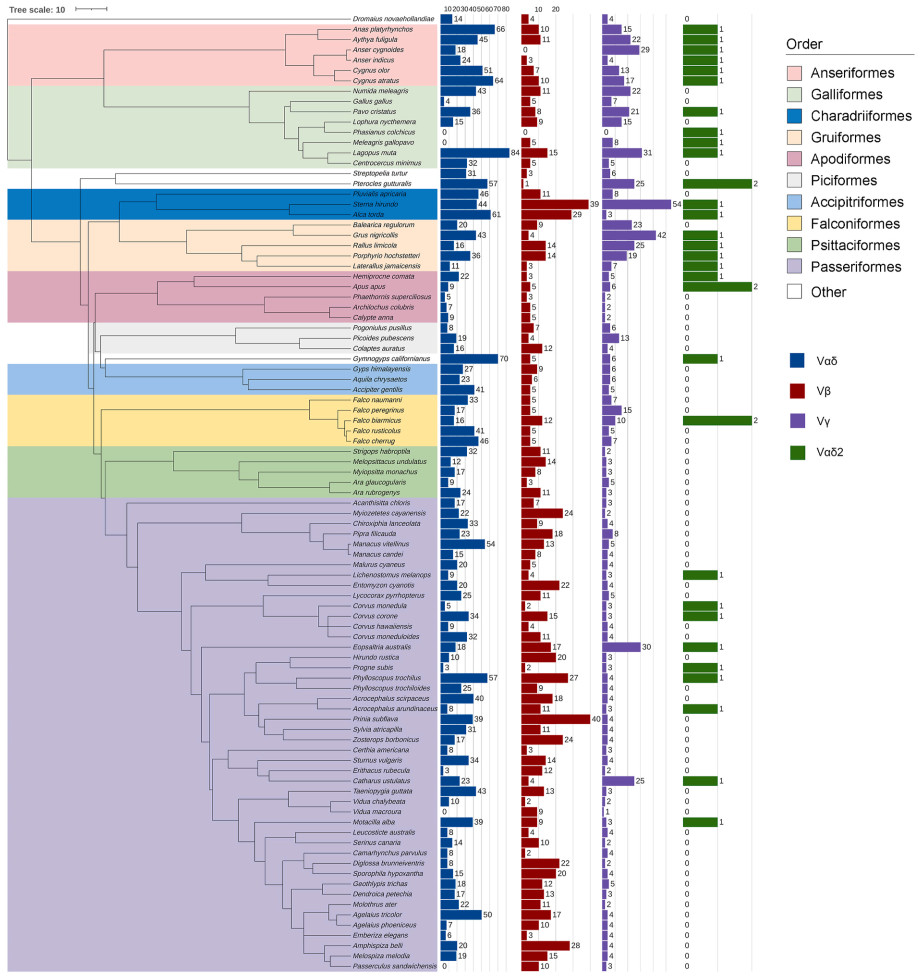
In most species, Vαδ, Vβ, and Vγ existed in multiple copies, and the copy numbers varied significantly among species (Vαδ: maximum = 84, median = 20; Vβ: maximum = 40, median = 9; Vγ: maximum = 54, median = 4). However, Vαδ2 was absent or only present in a single copy in most of the analyzed species. Only two copies were identified in Apus apus and Streptopelia turtur. Analysis of the genome scaffold N50, assemble levels, and TCR-V gene copy numbers revealed they had no correlations (Pearson's test and PGLS model). These data on TCR-V gene copy numbers can be used in subsequent studies.
We constructed a phylogenetic distribution map encompassing all 93 species included in this study to gain deeper insight into the phylogenetic patterns of TCR-V copy number variation in birds (Fig. 1). Vαδ2 and Vγ exhibited distinct evolutionary clade distribution patterns. Their copy numbers were decreased significantly at the boundary between Apodiformes and Gruiformes. This suggests that TCR-V copy numbers vary along the evolutionary trajectories.
Figure
1.
Potential functional TCR-V copy number estimation in 93 birds. The nodal bar chart shows the number of copies of the different types of TCR-V genes. Phylogenetic relationship was constructed using VertLife.
Furthermore, there was a significant difference in the TCR-V copy numbers between Passeriformes and non-Passeriformes for Vβ (Wilcoxon test, P = 0.0037; average = 11.080 and 9.279 for Passeriformes and non-Passeriformes, respectively), Vγ (Wilcoxon test, P < 0.001; average = 4.600 and 12.302 for Passeriformes and non-Passeriformes, respectively), and Vαδ2 (Wilcoxon test, P = 0.0065; average = 0.200 and 0.535 for Passeriformes and non-Passeriformes, respectively). However, no significant differences were observed in Vαδ copy number (P = 0.1100). Moreover, significant differences were observed in Vαδ distributions (Kruskal–Wallis test, P = 0.0027), Vαδ2 (Kruskal–Wallis test, P < 0.001), Vβ (Kruskal–Wallis test, P = 0.0140), and Vγ (Kruskal–Wallis test, P < 0.001) among the different orders.
3.2
TCR-V copy number variation positively associated with body mass but negatively associated with migration
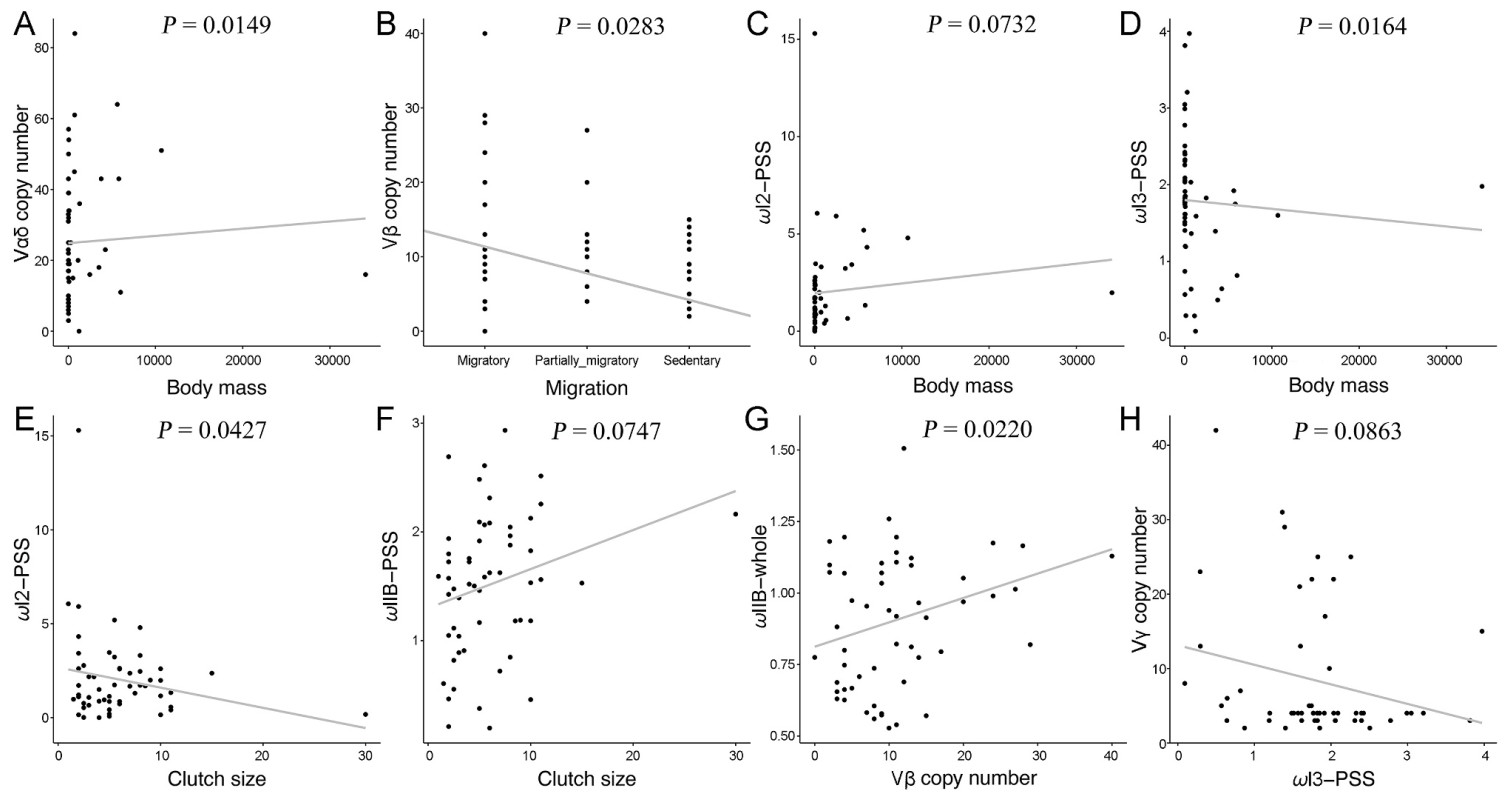
The copy numbers of Vαδ were positively associated with body mass (Fig. 2A; t = 2.5914, P = 0.0149). Vβ copy number was negatively associated with migration (Fig. 2B; t = 2.7634, P = 0.0283). However, in the current model, no significant correlation was observed between TCR-V copy number and clutch size.
Figure
2.
The PGLS model fits environmental factors, TCR-V gene copy number, and MHC selection pressure. (A) Vαδ copy number vs. body mass. (B) Vβ copy number vs. migration. (C) ω-PBR-I2 vs. body mass. (D) ω-PBR-I3 vs. body mass. (E) ω-PBR-I3 vs. clutch size. (F) ω-PBR-ⅡB vs. clutch size. (G) ω-whole-ⅡB vs. Vβ copy number. (H) Vγ copy number vs. ω-PBR-I3.
3.3
MHC PBR region selection pressure is related to body mass and clutch size
When comparing different avian orders, significant differences in MHC selection pressure were detected across the three peptide-binding exons (Kruskal–Wallis test, P < 0.001 for whole-MHC-I2 and whole-MHC-ⅡB, P = 0.0245 for whole-MHC-I3). However, only the PBR region differed between PBR-MHC-I3 (Kruskal–Wallis test, P = 0.0075) and PBR-MHC-ⅡB (Kruskal–Wallis test, P = 0.0284) among avian orders. No significant differences were observed in PBR-MHC-I2 (Kruskal–Wallis test, P = 0.0934). To comprehensively identify the factors influencing selection pressure, we included the six datasets in a phylogenetic generalized least squares model that involved incorporating the three ecological factors mentioned above.
No significant association was found between MHC whole exon selective pressure and ecological factors. Body mass was positively correlated with ω-PBR-I2 but negatively correlated with ω-PBR-I3 (Fig. 2C and D; ω-PBR-I2: t = 1.8114, P = 0.0732; ω-PBR-I3: t = −2.4157, P = 0.0164). Furthermore, clutch size was negatively correlated with ω-PBR-I2 and positively correlated with ω-PBR-ⅡB (Fig. 2E and F; ω-PBR-I2: t = −2.1850, P = 0.0427; ω-PBR-ⅡB: t = 1.6718, P = 0.0747).
3.4
TCR-Vβ copy number is related to ω-whole-ⅡB, and TCR-Vγ copy number is related to ω-PBR-I3
PGLS analysis revealed a positive correlation between ω-whole-ⅡB and Vβ copy number (t = 2.1158, P = 0.0220) (Fig. 2G) in birds. Similarly, the model revealed a negative correlation between ω-PBR-I3 and Vγ copy number (t = −1.7493, P = 0.0863) (Fig. 2H). In addition, Pearson's test was used to analyze the relationship between TCR-V gene copy numbers and MHC selection pressure. These findings were consistent (Pearson's test, P < 0.01 for Vβ copy number vs. ω-whole-ⅡB).
3.5
Complex relationships may exist between environmental factors and immune-related genes during evolution
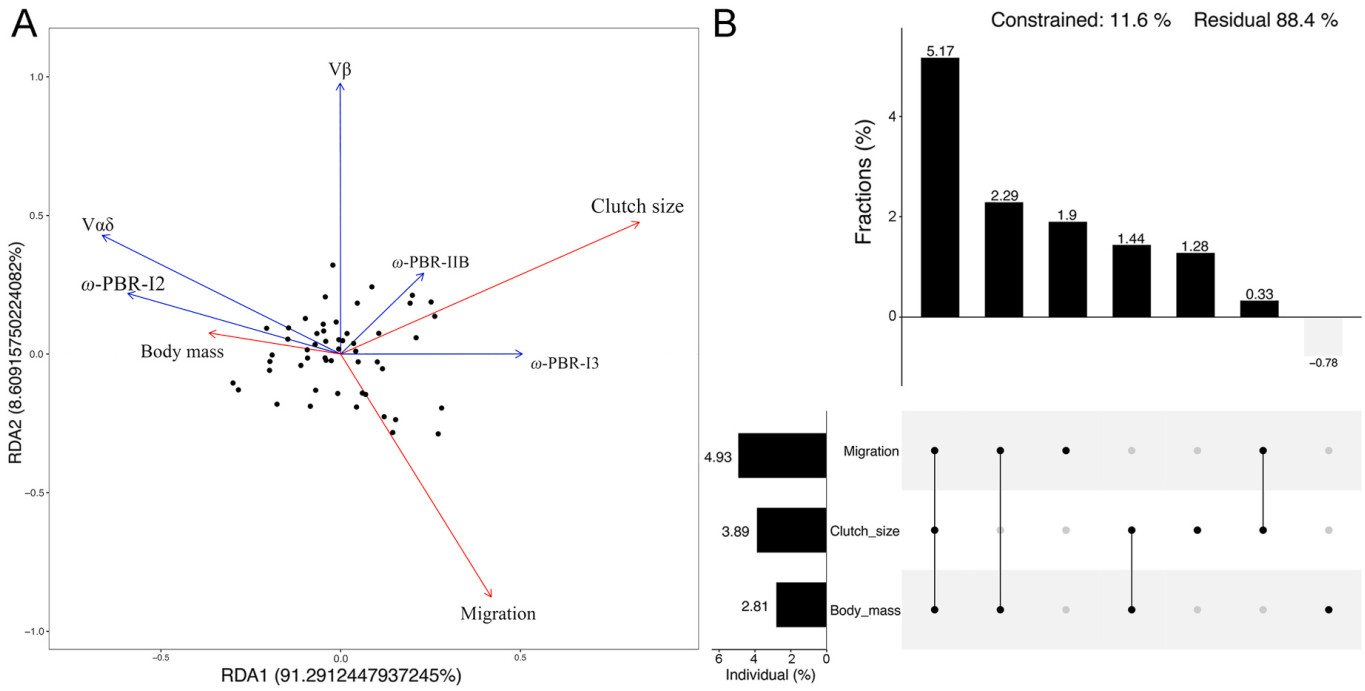
To further investigate the influence of environmental factors on immune-related genes, we conducted RDA. First, we assessed the goodness-of-fit of the model (R2 = 0.3738; R2adj. = 0.3057). Additionally, we assessed the significance of the RDA model using an analysis of variance (ANOVA), which indicated that the explanatory power of the model was statistically significant (P = 0.001). The total explained variance in the results was 37.38%.
RDA1 explains 34.12% of the variance in the model, clutch size (constraining variable score = 0.6599) and migration (constraining variable score = 0.3329) were identified as vital ecological factors. RDA2 explains 3.22% of the variance in the model, and migration (constraining variable score = −0.21372) was identified as a crucial environmental factor (Fig. 3A).
Figure
3.
(A) The RDA model fits the results of environmental factors, TCR-V gene copy numbers, and MHC selection pressure. (B) UpSet matrix of variance decomposition and level segmentation.
Variables such as the ω-PBR-I3 had high positive loadings on the RDA1 axis. This indicates that ω-PBR-I3 and ω-PBR-ⅡB were positively associated with clutch size and migration but negatively associated with body mass. However, ω-PBR-I2 and Vαδ copy number had a negative loading on the RDA1 axis, implying opposite results. Clutch size and body mass may antagonistically influence the balance between ω-PBR-I2 and ω-PBR-I3 on RDA1, as well as Vαδ copy number. Similarly, we observed a high positive loading of Vβ and a negative loading of migration on the RDA2 axis, suggesting that migration influences Vβ copy number in birds, which is consistent with the results of our PGLS model analysis (Fig. 3B).
The relative significance of ecologic factors in the model was reflected primarily in migration (4.93%), clutch size (3.89%), and body mass (2.81%). The high proportion of shared effects (5.17%) observed among migration, body mass, and clutch size suggests a potential interaction or interdependence among the three variables. Furthermore, our findings suggest that the interaction between body mass and migration (2.29%) may be a significant factor influencing ω-PBR-I2 and Vαδ copy number (Fig. 3B).
4.
Discussion
To our knowledge, this study is the first to investigate TCR-V copy numbers across avian species and their potential ecological correlations. Previous studies have primarily focused on elucidating the evolutionary mechanisms underlying MHC and other immune-related genes in a few bird species (Westerdahl et al., 2004; Promerová et al., 2013; Sepil et al., 2013; O'Connor et al., 2018; Minias et al., 2020). However, given the inseparable relationship between MHC and TCR genes, investigating the role of TCR genes is crucial. In this study, we conducted a comprehensive analysis of the associations among MHC selection pressure, TCR-V copy number, and ecological factors in birds. Our findings revealed that: 1) migration is related to TCR-Vβ copy number; 2) investment to fitness, such as reproductive output and growth investment, are prominent factors significantly associated with MHC selection pressure; and 3) TCR-Vαδ copy number and MHC-I selection pressure are associated and are correlated with body mass.
4.1
Variations in the four TCR-V genes could be partly explained by evolutionary factors
In this study, we initially observed significant variations in the copy numbers of the four TCR-Vs across different orders. Several hypotheses have been proposed to explain this phenomenon. First, it could be attributed to evolutionary history; variations in TCR-V copy numbers may result from mechanisms such as duplication, gene recombination, or gene relocation. Closely-related species within an evolutionary branch may have acquired similar copy numbers (Jarvis et al., 2014; Wang et al., 2023b). Previous studies have also demonstrated heterogeneity in immune-related gene copy numbers within clades, with the highest diversification of MHC copy numbers occurring relatively late in avian radiation, primarily among the Passeriformes (Minias et al., 2019). Large-scale ruminant genome sequencing has revealed that the lysozyme C family has expanded to 10 or more copies, which is believed to have evolved along with the digestion of microbe-rich contents in the gut (Chen et al., 2019). Therefore, the Passeriformes and non-Passeriformes differ significantly. Passeriformes exhibit a low number of Vγ; however, their Vβ number is high (Fig. 1), whereas non-Passeriformes display the opposite pattern. This suggests that these two super-clades undergo varying gene duplications throughout their evolution, potentially resulting in distinct TCR molecular diversity. Notably, Galloanserae and Cursorimorphae (Charadriiformes and Gruiformes) possess Vαδ2, but not Telluraves and Aequornithia within Passerea's branches (following birds' branches) (Jarvis et al., 2014). The distinct evolutionary clade distribution patterns of the TRD2 gene, particularly the significant decrease in copy numbers at the boundary between Apodiformes and Gruiformes, serve as compelling evidence for evolutionary changes along the lineage.
4.2
Evolution of TCR-V copy numbers might play a significant role in fitness and is influenced by pathogens in the habitat and lifetime
Reproduction and immune defense have been observed to trade off in various animals (Schwenke et al., 2016). Studies on immune-related genes and reproductive output have focused on MHC diversity, supporting the rare allele hypothesis and heterozygote advantage mechanism. The rare allele hypothesis states that individuals with rarer alleles have an advantage in pathogen resistance, as they can recognize several pathogens. The heterozygote advantage mechanism suggests that heterozygotes, carrying two different alleles, have higher resistance to pathogens than homozygotes do (Westerdahl et al., 2005; Biedrzycka et al., 2018). These studies have predicted a positive correlation between MHC diversity and fitness-related traits among individuals. Positive linear relationships between MHC diversity and reproduction or survival have been demonstrated in species such as the Egyptian Vulture (Neophron percnopterus; Agudo et al., 2012), Magellanic Penguin (Spheniscus magellanicus; Knafler et al., 2012), and the Common Yellowthroat (Geothlypis trichas; Dunn et al., 2013). These findings reflect correlations at the individual level, whereas our study reveals that this effect extends to the macro-evolutionary level. We observed significant correlations between body mass and both TCR-Vαδ copy number and MHC-I selection pressure, as well as significant correlation between clutch size and selection pressure. Species with a robust immune system (indicated by stronger selection of MHC-ⅡB) produce more offspring and have a higher reproductive output. Expect the invest in offspring, the immune system is also suggested to be related to individual physical character (body mass). A strong relation was detected between body mass and life span. These traits are considered to be associated with increased pathogen exposure and positively affect MHC gene copy numbers. Our finding emphasizes the positive association between fitness-related traits and immune-related gene selection.
Pathogens, which birds may encounter through social interactions during their existence, prompt a balance between investing in their immune system and other morphological traits. When closely related taxa are exposed to similar selective pressures, parallel evolution is expected. This has been observed in high-elevation adaptations among various bird species with a high similarity in gene function (Hao et al., 2019), including 19 Paridae species (Cheng et al., 2021), snowfinches (Qu et al., 2021), and Tibetan Ground Tits (Wang et al., 2023a). These studies provide evidence for parallel evolution in high-elevation adaptations, with similar gene functions involved across these bird species. Our analysis using PGLS modeling revealed significant association between migration and Vβ copy number. Migratory species face higher pathogen challenges, resulting in more pressure on immune gene evolution. Pathogen communities shape the evolution of the immune system in birds during colonization and migration. Studies on the assemblages of Plasmodium and related parasites in birds have suggested that migratory birds are more likely to share parasites with resident birds than with passing birds (Huang et al., 2022). The findings are consistent with our research results. Another study on the relationship between bat migration differences and immune function obtained similar conclusions (Rogers et al., 2022). However, we did not observe association between habitat types and immune genes. Birds in wet tropical regions with more water-borne pathogens (O'Connor et al., 2020), such as mosquitoes (Ruiz et al., 2010; Okanga et al., 2013), avian influenza (Roche et al., 2009), and avian malaria (Auld et al., 2004; Okanga et al., 2013), have evolved stronger pathogen recognition abilities in their immune system; however, this phenomenon was not observed in our results. This could be owing to using centroid latitude rather than detailed types of habitat in ecological factors.
In addition to environmental risks, pathogen selection is influenced by dietary patterns and intestinal bacteria. Scavenging birds, including certain vultures, exhibit extensive positive selection for immune-related genes (Zou et al., 2021; Chen et al., 2023). Recent studies have revealed associations between specific MHC alleles and the diversity and composition of the gut microbiome in Seychelles Warblers (Acrocephalus sechellensis, MHC-I) (Davies et al., 2022) and Neotropical Bats (Artibeus jamaicensis, MHC-Ⅱ diversity) (Fleischer et al., 2022). Some factors, which were strongly correlated with trophic level, were analyzed in the PGLS model, which suggested no significant relationship. Further studies about scavenging birds might improve the understanding.
4.3
Co-evolution of TCR and MHC genes
There is a paradox between the extreme polymorphism of MHC alleles in populations and the limited number of MHC loci in individuals. The most popular explanation is an evolutionary trade-off between an increased capacity to recognize pathogens and a compromised immune response caused by mechanisms that maintain immune self-tolerance (Vidović and Matzinger, 1988). This trade-off is likely mediated by the complex interplay between MHC and the TCR repertoire, suggesting a co-evolutionary relationship between these two crucial components of the immune system. Studies in the Bank Vole (Myodes glareolus) revealed a TCR depletion model for MHC-I, suggesting that the TCR repertoire should be inversely related to individual MHC diversity, while CD4 + TCR richness was positively correlated with MHC Class Ⅱ diversity (Migalska et al., 2019, 2024). However, in this study, we could not directly analyze the richness of the TCR repertoire and MHC diversity. The copy numbers of Vαδ genes and the selection pressure of MHCI-PBR are responsive to body mass, and the positive correlation between TCR-Vβ copy number and ω-whole-ⅡB supports the co-evolution between them.
Our model analysis had certain limitations. Although multiple environmental factors and other variables collectively influence immune gene evolution, we focused on a subset of the factors to explore their correlations. We acknowledge that there may be additional factors influencing immune evolution that were not included in our analysis, which prevents us from providing a comprehensive explanation of immune gene evolution. Furthermore, considering there are nearly 10,000 bird species, our sample of 93 species might not adequately represent the diversity. However, our study still showed that species with a robust immune system can effectively combat pathogens and external pressures and adapt better to adverse environmental conditions. Hence, they have a reduced risk of infection and disease and reproduce in a more diverse environment, improving their survival and reproductive output. Additionally, regarding energy allocation, species with a strong immune system may allocate energy more efficiently, directing a greater proportion of energy toward the reproductive process and increasing their annual clutch size.
5.
Conclusion
We investigated the interrelationships among MHC selection pressure, TCR-V copy number, and ecological factors. We observed that body mass and clutch size were significantly correlated with TCR-V copy numbers and MHC selection pressure. In addition, a positive correlation was observed between MHC-I, TCR-Vγ, and body mass. Furthermore, migration influenced TCR-Vβ. These findings suggest that pathogen selection may influence immune-related genes in habitats. Moreover, species with potentially strong immune systems (higher TCR-Vβ numbers) are expected to produce more offspring. However, the interaction between MHC and TCR molecules in the CDR1 and CDR2 regions of TCR genes does not directly correlate with the TCR-V gene copy number. This could complicate our understanding of the underlying mechanisms.
The authors declare that they have no known competing financial interests or personal relationships that could have appeared to influence the work reported in this paper.
Acknowledgements
We thank three anonymous reviewers' suggestions for our work.
Agudo, R., Carrete, M., Alcaide, M., Rico, C., Hiraldo, F., Donázar, J.A., 2012. Genetic diversity at neutral and adaptive loci determines individual fitness in a long-lived territorial bird. Proc. Biol. Sci. 279, 3241–3249.
Arstila, T.P., Casrouge, A., Baron, V., Even, J., Kanellopoulos, J., Kourilsky, P., 1999. A direct estimate of the human alphabeta T cell receptor diversity. Science 286, 958–961.
Auld, H., MacIver, D., Klaassen, J., 2004. Heavy rainfall and waterborne disease outbreaks: the Walkerton example. J. Toxicol. Env. Heal. A 67, 1879–1887.
Biedrzycka, A., Bielański, W., Ćmiel, A., Solarz, W., Zając, T., Migalska, M., et al., 2018. Blood parasites shape extreme major histocompatibility complex diversity in a migratory passerine. Mol. Ecol. 27, 2594–2603.
Bush, S.E., Clayton, D.H., 2018. Anti-parasite behaviour of birds. Philos. T. Roy. Soc. B 373, 20170196.
Chen, C., Chen, H., Zhang, Y., Thomas, H.R., Frank, M.H., He, Y., et al., 2020. TBtools: an integrative toolkit developed for interactive analyses of big biological data. Mol. Plant 13, 1194–1202.
Chen, L., Qiu, Q., Jiang, Y., Wang, K., Lin, Z., Li, Z., et al., 2019. Large-scale ruminant genome sequencing provides insights into their evolution and distinct traits. Science 364, eaav6202.
Chen, Y., Xiang, L., Chen, P., Zhao, H., 2023. Vultures as a model for testing molecular adaptations of dietary specialization in birds. Avian Res. 14, 100128.
Cheng, Y., Miller, M.J., Zhang, D., Xiong, Y., Hao, Y., Jia, C., et al., 2021. Parallel genomic responses to historical climate change and high elevation in East Asian songbirds. P. Natl. Acad. Sci. U.S.A. 118, e2023918118.
Cichoń, M., Dubiec, A., 2005. Cell-mediated immunity predicts the probability of local recruitment in nestling blue tits. J. Evol. Biol. 18, 962–966.
Davies, C.S., Worsley, S.F., Maher, K.H., Komdeur, J., Burke, T., Dugdale, H.L., et al., 2022. Immunogenetic variation shapes the gut microbiome in a natural vertebrate population. Microbiome 10, 41.
Dunn, P.O., Bollmer, J.L., Freeman-Gallant, C.R., Whittingham, L.A., 2013. MHC variation is related to a sexually selected ornament, survival, and parasite resistance in common yellowthroats. Evolution 67, 679–687.
Fleischer, R., Schmid, D.W., Wasimuddin, Brändel, S.D., Rasche, A., Corman, V.M., et al., 2022. Interaction between MHC diversity and constitution, gut microbiota and Astrovirus infections in a neotropical bat. Mol. Ecol. 31, 3342–3359.
Früh, S.P., Früh, M.A., Kaufer, B.B., Göbel, T.W., 2024. Unraveling the chicken T cell repertoire with enhanced genome annotation. Front. Immunol. 15, 1359169.
Gurevich, A., Saveliev, V., Vyahhi, N., Tesler, G., 2013. QUAST: quality assessment tool for genome assemblies. Bioinformatics 29, 1072–1075.
Hao, Y., Xiong, Y., Cheng, Y., Song, G., Jia, C., Qu, Y., et al., 2019. Comparative transcriptomics of 3 high-altitude passerine birds and their low-altitude relatives. P. Natl. Acad. Sci. U.S.A. 116, 11851–11856.
He, K., Minias, P., Dunn, P., 2020. Long-read genome assemblies reveal extraordinary variation in the number and structure of MHC loci in birds. Genome Biol. Evol. 13, evaa270.
Huang, X., Chen, Z., Yang, G., Xia, C., Luo, Q., Gao, X., et al., 2022. Assemblages of Plasmodium and related parasites in birds with different migration statuses. Int. J. Mol. Sci. 23, 10277.
Irla, M., 2022. Instructive cues of thymic T cell selection. Ann. Rev. Immunol. 40, 95–119.
Jarvis, E.D., Mirarab, S., Aberer, A.J., Li, B., Houde, P., Li, C., et al., 2014. Whole-genome analyses resolve early branches in the tree of life of modern birds. Science 346, 1320–1331.
Knafler, G.J., Clark, J.A., Boersma, P.D., Bouzat, J.L., 2012. MHC diversity and mate choice in the magellanic penguin, Spheniscus magellanicus. J. Hered. 103, 759–768.
Liang, C., Sun, L., Zhu, Y., Wu, J., Zhao, A., Huang, T., et al., 2024. Local chicken breeds exhibit abundant TCR-V segments but similar repertoire diversity. Dev. Comp. Immunol. 157, 105196.
Liang, C., Sun, L., Zhu, Y., Zhao, A., Liu, H., He, K., 2023. Macroevolution of avian T cell receptor C segments using genomic data. Immunogenetics 75, 531–541.
Liu, F., Li, J., Lin, I.Y.C., Yang, X., Ma, J., Chen, Y., et al., 2020. The genome esequencing of TCR loci in Gallus gallus revealed their distinct evolutionary features in avians. Immunohorizons 4, 33–46.
Luzuriaga-Neira, A.R., Alvarez-Ponce, D., 2022. Rates of protein evolution across the marsupial phylogeny: heterogeneity and link to life-history traits. Genome Biol. Evol. 14, evab277.
Merelli, I., Guffanti, A., Fabbri, M., Cocito, A., Furia, L., Grazini, U., et al., 2010. RSSsite: a reference database and prediction tool for the identification of cryptic Recombination Signal Sequences in human and murine genomes. Nucleic Acids Res. 38, W262–W267.
Migalska, M., Sebastian, A., Radwan, J., 2019. Major histocompatibility complex class I diversity limits the repertoire of T cell receptors. P. Natl. Acad. Sci. U.S.A. 116, 5021–5026.
Migalska, M., Węglarczyk, K., Dudek, K., Homa, J., 2024. Evolutionary trade-offs constraining the MHC gene expansion: beyond simple TCR depletion model. Front. Immunol. 14, 1240723.
Minias, P., Gutiérrez, J.S., Dunn, P.O., 2020. Avian major histocompatibility complex copy number variation is associated with helminth richness. Biol. Lett. 16, 20200194.
Minias, P., Pikus, E., Whittingham, L.A., Dunn, P.O., 2019. Evolution of copy number at the MHC varies across the avian tree of life. Genome Biol. Evol. 11, 17–28.
Minias, P., Whittingham, L.A., Dunn, P.O., 2017. Coloniality and migration are related to selection on MHC genes in birds. Evolution 71, 432–441.
O'Connor, E.A., Cornwallis, C.K., Hasselquist, D., Nilsson, J., Westerdahl, H., 2018. The evolution of immunity in relation to colonization and migration. Nat. Ecol. Evol. 2, 841–849.
O'Connor, E.A., Hasselquist, D., Nilsson, J., Westerdahl, H., Cornwallis, C.K., 2020. Wetter climates select for higher immune gene diversity in resident, but not migratory, songbirds. Proc. Biol. Sci. 287, 20192675.
Okanga, S., Cumming, G.S., Hockey, P.A., 2013. Avian malaria prevalence and mosquito abundance in the Western Cape, South Africa. Malaria J 12, 370.
Orme, D., Freckleton, R.P., Thomas, G.H., Petzoldt, T., 2013. Caper: comparative analyses of phylogenetics and evolution in R. Methods Ecol. Evol. 3, 145–151.
Pagel, M., 1997. Inferring evolutionary processes from phylogenies. Zool. Scr. 26, 331–483.
Parra, Z.E., Miller, R.D., 2012. Comparative analysis of the chicken TCRα/δ locus. Immunogenetics 64, 641–645.
Podos, J., Webster, M.S., 2022. Ecology and evolution of bird sounds. Curr. Biol. 32, R1100–R1104.
Promerová, M., Králová, T., Bryjová, A., Albrecht, T., Bryja, J., 2013. MHC class ⅡB exon 2 polymorphism in the Grey partridge (Perdix perdix) is shaped by selection, recombination and gene conversion. PLoS One 8, e69135.
Qu, Y., Chen, C., Chen, X., Hao, Y., She, H., Wang, M., et al., 2021. The evolution of ancestral and species-specific adaptations in snowfinches at the Qinghai-Tibet Plateau. P. Natl. Acad. Sci. U.S.A. 118, e2012398118.
Roche, B., Lebarbenchon, C., Gauthier-Clerc, M., Chang, C.M., Thomas, F., Renaud, F., et al., 2009. Water-borne transmission drives avian influenza dynamics in wild birds: the case of the 2005–2006 epidemics in the Camargue area. Infect. Genet. Evol. 9, 800–805.
Rogers, E.J., McGuire, L., Longstaffe, F.J., Clerc, J., Kunkel, E., Fraser, E., 2022. Relating wing morphology and immune function to patterns of partial and differential bat migration using stable isotopes. J. Anim. Ecol. 91, 858–869.
Ruiz, M.O., Chaves, L.F., Hamer, G.L., Sun, T., Brown, W.M., Walker, E.D., et al., 2010. Local impact of temperature and precipitation on West Nile virus infection in Culex species mosquitoes in Northeast Illinois, USA. Parasit. Vectors 3, 19.
Saino, N., Szép, T., Ambrosini, R., Romano, M., Møller, A.P., 2004. Ecological conditions during winter affect sexual selection and breeding in a migratory bird. Proc. Biol. Sci. 271, 681–686.
Schwenke, R.A., Lazzaro, B.P., Wolfner, M.F., 2016. Reproduction-immunity trade-offs in insects. Ann. Rev. Entomol. 61, 239–256.
Sepil, I., Lachish, S., Hinks, A.E., Sheldon, B.C., 2013. Mhc supertypes confer both qualitative and quantitative resistance to avian malaria infections in a wild bird population. Proc. Biol. Sci. 280, 20130134.
Shah, K., Al-Haidari, A., Sun, J., Kazi, J.U., 2021. T cell receptor (TCR) signaling in health and disease. Signal Transduct. Target. Ther. 6, 412.
Tieleman, B.I., 2018. Understanding immune function as a pace of life trait requires environmental context. Behav. Ecol. Sociobiol. 72, 55.
Tobias, J.A., Sheard, C., Pigot, A.L., Devenish, A.J.M., Yang, J., Sayol, F., et al., 2022. AVONET: morphological, ecological and geographical data for all birds. Ecol. Lett. 25, 581–597.
Vidović, D., Matzinger, P., 1988. Unresponsiveness to a foreign antigen can be caused by self-tolerance. Nature 336, 222–225.
Vinkler, M., Fiddaman, S.R., Těšický, M., O'Connor, E.A., Savage, A.E., Lenz, T.L., et al., 2023. Understanding the evolution of immune genes in jawed vertebrates. J. Evol. Biol. 36, 847–873.
Wang, Y., Wang, C., Hong, W., Tian, S., Lu, Q., Wang, B.J., et al., 2023a. Genomic analysis of Tibetan ground tits identifies molecular adaptations associated with cooperative breeding. Curr. Zool. 69, 620–630.
Wang, Z., Wang, Y.W., Kasuga, T., Hassler, H., Lopez-Giraldez, F., Dong, C., et al., 2023b.
Origins of lineage-specific elements via gene duplication, relocation, and regional rearrangement in Neurospora crassa. Mol. Ecol. .
Westerdahl, H., Waldenström, J., Hansson, B., Hasselquist, D., von Schantz, T., Bensch, S., 2005. Associations between malaria and MHC genes in a migratory songbird. Proc. Biol. Sci. 272, 1511–1518.
Westerdahl, H., Wittzell, H., von Schantz, T., Bensch, S., 2004. MHC class I typing in a songbird with numerous loci and high polymorphism using motif-specific PCR and DGGE. Heredity 92, 534–542.
Yang, H., Wang, Y., Jia, Z., Wang, Y., Yang, X., Wu, P., et al., 2021. Characteristics of T-cell receptor repertoire and correlation with EGFR mutations in all stages of lung cancer. Front. Oncol. 11, 537735.
Yang, Z., Sun, Y., Ma, Y., Li, Z., Zhao, Y., Ren, L., et al., 2017. A comprehensive analysis of the germline and expressed TCR repertoire in White Peking duck. Sci. Rep. 7, 41426.
Zhang, L., Liu, Y., Meng, G., Liang, R., Zhang, B., Xia, C., 2020. Structural and biophysical insights into the TCRαβ complex in chickens. iScience 23, 101828.
Zou, D., Tian, S., Zhang, T., Zhuoma, N., Wu, G., Wang, M., et al., 2021. Vulture genomes reveal molecular adaptations underlying obligate scavenging and low levels of genetic diversity. Mol. Biol. Evol. 38, 3649–3663.

 DownLoad:


 Email Alerts
 RSS Feeds