Figure
1.
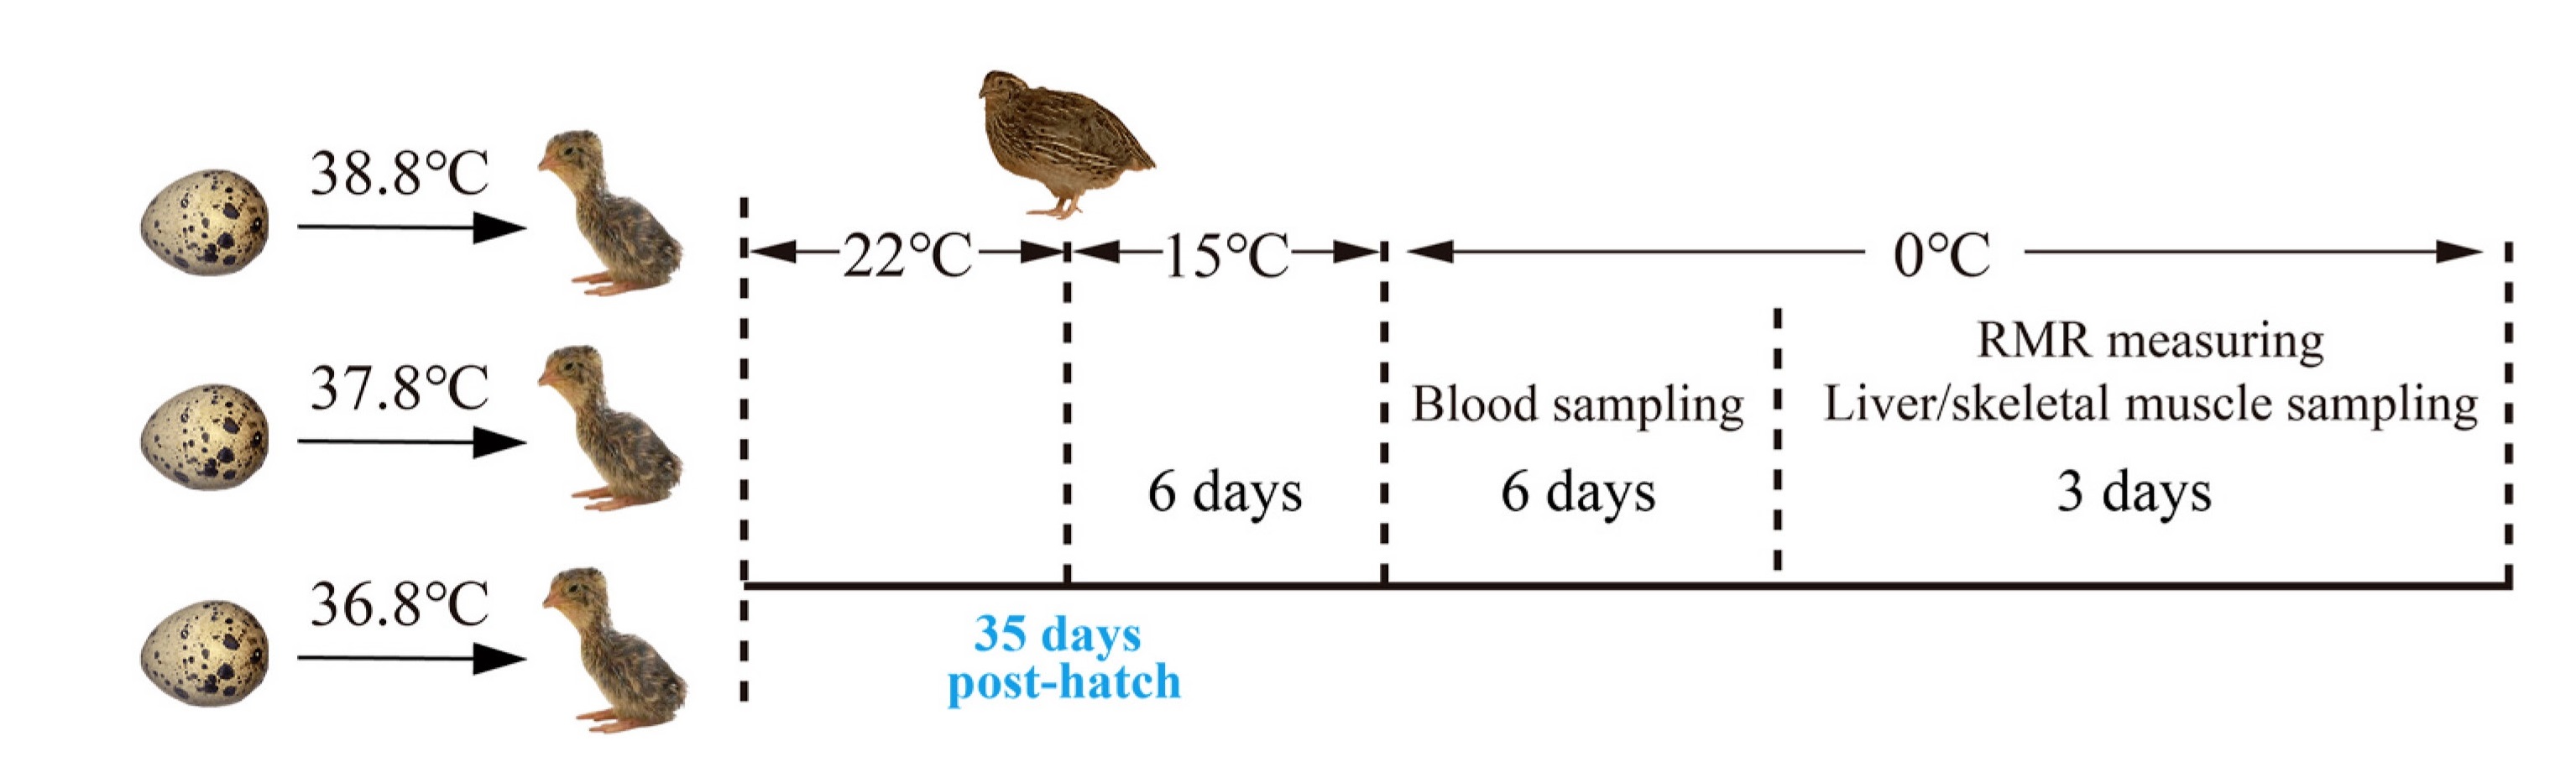
Schematic diagram of experimental design. Dph is the day post hatching.
| Citation: |
Yingxin Kou, Rongmiao Zhang, Xiaoqian Li, Na Zhu, Yihang Huang, Shuping Zhang. 2024: Incubation temperature induced developmental plasticity of cold responsive physiological phenotypes in Japanese Quails. Avian Research, 15(1): 100193. DOI: 10.1016/j.avrs.2024.100193

|
Embryonic development is a critical period for phenotype formation. Environmental variation during embryonic development can induce changes in postnatal phenotypes of animals. The thyroxine secretion and aerobic metabolic activity of small birds are important phenotypes closely related to their winter survival. In the context of climate change, it is necessary to determine whether temperature variation during incubation in birds leads to developmental plasticity of these cold responsive phenotypes. We incubated Japanese Quail (Coturnix japonica) eggs at 36.8 ℃, 37.8 ℃, and 38.8 ℃, and raised the chicks to 35-day old at 22 ℃ with same raising conditions, then all the quails were exposed to gradually temperature dropping environment (from 15 ℃ to 0 ℃). After cold treatment, serum T3 level, resting metabolic rate, skeletal muscle and liver metabolomes of the birds were measured. The serum T3 levels were significantly lower in the 38.8 ℃ group and significantly higher in the 36.8 ℃ group compared to the 37.8 ℃ group. The metabolic rate in the 38.8 ℃ group was significantly lower compared to the 37.8 ℃ group. Compared with the 37.8 ℃ group, metabolites involved in the tricarboxylic acid cycle in the liver were significantly lower in the 38.8 ℃ group, and metabolites related to lipid oxidation metabolism and fatty acid biosynthesis were significantly lower in the skeletal muscles in the 38.8 ℃ group but significantly higher in the 36.8 ℃ group. These results indicate that incubation temperature variation can lead to developmental plasticity in cold responsive physiological phenotypes. Higher incubation temperature may impair the capacity of birds coping with cold challenge.
The embryonic development of animals plays a critical role in determining individual phenotypes and is also a vulnerable stage susceptible to environmental changes (Monaghan, 2008). Developmental plasticity is the irreversible change in phenotype caused by changes in environmental conditions during development (Moran, 1992; Uller, 2008). Animals are inevitably exposed to changes in environmental factors during different life stages. Inductive factors are environmental factors that can induce changes in embryonic development, whereas selective factors are responsible for discriminating the fitness of induced phenotypes (Nijhout, 2003). A mismatch between inductive and selective factors can lead to a decrease in the fitness of induced phenotypes (Saxon et al., 2018). Thus, exploring the relationship between the responses of animals to inductive and selective factors is important for understanding the ecological significance of developmental plasticity.
Variation in ambient temperature has been shown to influence embryonic development of oviparous animals by altering embryonic temperature, resulting in different morphological, behavioral and physiological phenotypes (Du and Shine, 2015; Kamanli et al., 2015; Wada et al., 2015; Ben-Ezra and Burness, 2017). Global climate change is currently the main environmental factor affecting natural ecosystems (Weiskopf et al., 2020; Huggel et al., 2022), and the frequent occurrence of extreme temperatures has become a challenge for many organisms (Rahmstorf and Coumou, 2011; Wingfield et al., 2017; Stillman, 2019; Yin et al., 2023). In this context, animals with long lifespans may experience high temperature during development and low temperature challenge during postnatal stages (Kingsolver et al., 2011; Radchuk et al., 2013). Birds are oviparous vertebrates that have long life spans. The temperature induced developmental plasticity of birds is neglected for the incubation behavior of adult birds. Although the adult incubation regulates the thermal environment of developing embryos, adults leaving the nest to forage may expose the eggs to environmental temperatures (MacDonald et al., 2013; Coe et al., 2015; Ahmad and Li, 2023). Therefore, the effect of mismatch between developmental and postnatal environmental temperatures on birds should be paid attention in order to provide more information for understanding the mechanism climate change threatening the birds.
The thermogenesis capacity of small birds is important for determining their survival in winter (Swanson, 2010; Petit et al., 2017). It has been known that changes in incubation temperature of as little as 1 ℃ have been shown to induce changes in the metabolic rates of birds in thermal neutral environment. For example, a study on Blue Tit (Parus caeruleus) found that individuals exposed to higher incubation temperatures had lower resting metabolic rates compared to those exposed to lower incubation temperatures (Nord and Nilsson, 2011), and a study on Zebra Finch (Taeniopygia guttata) found that females incubated at 36.2 ℃ had elevated basal metabolic rates compared to those incubated at 37.4 ℃ (Wada et al., 2015). A field study on a Superb Fairy Wren (Malurus cyaneus) population in southeastern Australia found a significant increase in the winter mortality rate following heat waves during the breeding season (Lv et al., 2023). Therefore, higher temperatures during embryo development may result in individuals developing low thermogenesis phenotypes unsuited for cold winter.
Thyroid hormone has been shown to play an important regulatory role in thermoregulation of birds in response to cold challenge (Burger and Denver, 2002; Liu et al., 2006; Zheng et al., 2014). Cold exposure can increase Tri-iodothyronine (T3) levels in peripheral blood, then T3 can bind to receptors in the nucleus and mitochondria to improve thermogenesis by regulating cellular aerobic metabolism (Collin et al., 2003; Dridi et al., 2004; Decuypere et al., 2005; Liu et al., 2006; Tsibulnikov et al., 2020). Studies on wild birds have shown that serum T3 levels are positively correlated with metabolic rate in cold environments (Liu et al., 2006; Zheng et al., 2014). The liver and skeletal muscle is the main target organs of T3; thus, the adjustment of cellular aerobic metabolism in these two organs contributes to the metabolic rate flexibility of birds in response to ambient temperature variation (Liknes and Swanson, 2011; Barceló et al., 2017; Vézina et al., 2017). The cellular aerobic metabolism including oxidative decompositions of carbohydrates, lipids, and proteins in the liver and muscle cells release energy through glycolysis, tricarboxylic acid cycle, fatty acid oxidation and other catabolic processes (Liknes and Swanson, 2011; Blondin et al., 2015; Trefts et al., 2017; Vézina et al., 2017). The activities of these metabolic pathways determine cellular aerobic capacities (Liknes and Swanson, 2011). In addition, birds use lipids as their primary energy substrate in cold environments by increasing their lipid oxidation activity and enhancing enzyme activities in the tricarboxylic acid cycle and oxidative phosphorylation pathways (Liknes and Swanson, 2011; Stager et al., 2015; Zhang et al., 2015; Vézina et al., 2017). Therefore, the serum T3 level, metabolic rate, contents of metabolites of cellular aerobic metabolic pathways in the liver and skeletal muscle can comprehensively reflect the thermoregulatory capacity of birds in response to cold challenge.
In this paper, we predicted that different incubation temperatures could result in different thermoregulatory phenotypes of small birds in response to cold challenge. To test this, we incubated Japanese Quail (Coturnix japonica) eggs at different temperatures. We then exposed the 35-day-old quails hatched from these eggs to a gradually decreasing temperature and measured their serum T3, resting metabolic rate and metabolomes of liver and skeletal muscle.
We sourced fertilized Japanese Quail eggs from a breeding company in Jiangsu, China. An optimal incubation temperature is suggested to be around 37.8 ℃ for Japanese Quail eggs with high embryo mass, residual yolk and growth efficiency (Yilmaz et al., 2011; Ben-Ezra and Burness, 2017). Hence, we set the incubation temperature to 38.8 ℃ and 36.8 ℃ for the high and low-temperature incubation groups, respectively. The temperature inside the incubators had been verified using a thermometer (UNI-T325, China; accuracy ±0.2 ℃) before the experiment. For the artificial incubation, 105 fertilized Japanese Quail eggs were randomly divided into 38.8 ℃, 37.8 ℃ and 36.8 ℃ incubation groups (35 eggs in each group) and placed in three full-automatic incubators (BS24-36, Boshi Incubation) with the temperature set at 38.8 ±0.3 ℃, 37.8 ±0.3 ℃, and 36.8 ±0.3 ℃, respectively. The relative humidity for all three incubators was set to 55%, and the egg-turning cycle was set to 90 min before the 15th incubation day, then the egg-turning stopped. Totally, 23, 25 and 20 eggs hatched in the 36.8 ℃, 37.8 ℃ and 38.8 ℃ group, respectively. Then the chicks were well fed in heat preserved boxes (40 cm×30 cm×25 cm, 10 chicks per box, and temperature was controlled at 37.5 ℃ using electric blankets with temperature controllers) until the 5th day post hatching (dph). Then, the chicks were transferred into bird cages corresponding to three incubation temperatures (60 cm×40 cm×40 cm; 6 birds per cage) and placed into an artificial climate chamber (RXZ-500C, Ningbo Jiangnan Instrument) set at 22 ±1 ℃ (Ben-Hamo et al., 2010; Santana et al., 2021) with a 12L:12D photoperiod. The three groups of chicks were fed sufficient same diet (corn, soybean meal, wheat bran, etc.) and drinking water throughout the experimental period. The body mass of all quails were measured every day, and there was no body mass difference among three groups after the 25th day post hatch (Appendix Fig. S1). To the 35th day post hatch, a total of six males and six females in each incubation temperature group were assigned for subsequent low temperature exposure experiments. The birds (12×3 groups) were firstly housed in 15 ℃ environment for 6 days, then the temperature was changed into 0 ℃ for 9 days. During this period, at 8:00 a.m. on the 2nd and 6th days of 0 ℃ (housing) temperature treatment, 200 μL of blood was collected from the brachial vein of these birds. After standing for 20 min at 4 ℃, the serum was separated using a centrifuge (4 ℃, 3500 r/min, 10 min) and stored in a -80 ℃ ultra-cold freezer for peripheral blood T3 analysis. The T3 levels of the quails is the mean of the values on the 2nd and 6th days. After six days of 0 ℃ treatment, the metabolic rates of the eight birds (four males and four females selected from the 12 birds) in each incubation group were determined at 0 ℃, then six of them (three males and three females) in each incubation group were euthanized under anesthesia (Vézina et al., 2017) and the liver and skeletal muscle tissues were removed, immediately frozen in liquid nitrogen, and stored in a -80 ℃ ultra-cold freezer for metabolomics testing. The diagram of experimental designs is shown in Fig. 1.
We used respiratory gas exchange to estimate the CO2 production rate as a proxy for metabolic rate. The rates of CO2 production at 0 ℃ were measured respectively, using a Sable Open Breathalyzer System (USA) including Drierite drying columns, flow controller (MFC2), gas sampling unit (SS4), gas switching unit (MUX), CO2 analyzer (CA-10), O2 analyzer (OXZILLA), data logger (UI-2), animal respiration chamber (2750 mL) placed inside a temperature-controlled environmental chamber (Sanyo, MIR554-PC, Japan). Before measuring metabolic rate, the quails were fasted for 8 h. Simultaneously, the Stable Open Breathalyzer system was activated and the respiratory chamber (35 cm length, 10 cm diameter, 2748.9 mL) was flushed with dry air at a flow rate of 600 mL/min. The CO2 analyzers were calibrated to 0% and 1.00%. To measure CO2 production, one quail was placed in a breathable bag and placed in the respiratory chamber for 1 h. The body mass of the quails during the respiration measurement was determined as the average value before and after the measurement process. All measurements were conducted between 8:00 and 18:00. The data was recorded and analyzed using ExpeData (version 1.7.15) software. The period during which the individual produced the least amount of CO2 within 5 min was selected to calculate metabolic rate at 0 ℃. VCO2 was determined as the average amount of CO2 generated in 5 min. The calculation equation 10.7 in Lighton’s (2008) is:
| VCO2=FRi[(F'eCO2-F'iCO2)-F'eCO2(FiO2-F'eO2)]/(1-F'eCO2) |
where FRi is the flow rate in mL/min after STP correction, and F’i and F’e are gas concentrations entering and leaving the metabolic chamber, respectively. The metabolic rate of quails was calculated as the volume of CO2 produced per hour (mL CO2/h).
T3 serum levels were measured using an enzyme-linked immunosorbent assay kit (Nanjing Jiancheng Biotechnology Research Institute, China, H222) according to the manufacturer’s instructions. Briefly, 50 μL serum samples were taken for analysis, and the OD values of the reactants were determined using a microplate spectrophotometer (EpochTM, BioTek USA) set at a wavelength of 450 nm. The T3 concentration of the sample was calculated using the curve drawn between the OD value and concentration value of the standard samples. All samples were tested in triplicate. The intra- and inter-plate coefficients of variation for T3 were less than 10% and 12%, respectively.
The UHPLC-MS/MS assay was used to liver and skeletal muscle metabolomic analysis. To prepare the liver and skeletal muscle samples, 100 mg tissue samples were ground in a mortar with liquid nitrogen. The ground samples were transferred into 2 mL centrifuge tubes and vortexed with 500 μL of 80% aqueous methanol. The samples were then incubated on ice for 5 min and centrifuged at 15,000 g and 4 ℃ for 20 min. The resulting 300 μL supernatant was diluted with mass spectrometry grade water to obtain a methanol content of 53% before being centrifuged at 15,000 g and 4 ℃ for 20 min. Finally, the supernatant was collected for the UHPLC-MS/MS assay. In addition to the experimental samples, quality control (QC) samples were prepared by mixing an equal volume of each experimental sample. The QC samples were used to calibrate the chromatography-mass spectrometry system, monitor the condition of the instrument, and evaluate the stability of the system throughout the experiment. A blank sample was also run to remove background ions from the system. The SCIEX QTRAP® 6500 + mass spectrometry platform was used for UHPLC-MS/MS detection. Samples were injected onto an Xselect HSS T3 (2.1×150 mm, 2.5 μm) at 50 ℃ and a flow rate of 0.4 mL/min. The eluent A (0.1% formic acid-water) and eluent B (0.1% formic acid-acetonitrile) were selected for the eluent solutions. The positive polarity mode of the spectrometer was operated in the following conditions: Curtain gas 35 psi, collision gas at medium, IonSpray voltage 5500 V, temperature 550 ℃, with ion source gases 1 and 2 both having a flow rate of 60 mL/min. The negative polarity mode of the spectrometer was operated in the following conditions: Curtain gas 35 psi, collision gas at medium, IonSpray voltage -4500 V, temperature 550 ℃ with ion source gases 1 and 2 both having flow rates of 60 mL/min. The multiple reaction monitoring was used to identify and detect the metabolites in the liver and muscle samples based on the novo database (Novogene, Beijing). The data files generated by HPLC-MS/MS were processed using SCIEX OS Version 1.4 (www.sciex.com) to integrate and correct the peak. The main parameters were set as follows: Minimum peak height, 500; signal/noise ratio, 5; gaussian smooth width, 1. The area of each peak represents the relative content of the corresponding substance.
Linear mixed models (LMMs) were used to determine the effect of incubation temperature (36.8 ℃, 37.8 ℃, 38.8 ℃), body mass and sex on serum T3 and resting metabolic rate. In the models, incubation temperature (36.8 ℃, 37.8 ℃, 38.8 ℃), body mass, sex, the interaction of incubation temperature and body mass and the interaction of incubation temperature and sex were assigned as fixed factors, and individual was assigned as a random factor. If the effect of incubation temperature was significant, we used one-way ANOVA with LSD (least significant difference) multiple comparison to determine the difference among incubation temperatures. All these statistical analyses were conducted in SPSS version 22.0, with a significance level set at 0.05. The liver and skeletal muscle metabolite data were imported into SIMCA-P 11.5 (Umetrics, Sweden). Partial least-squares discriminant analysis (PLS-DA) was used to assess the differences in metabolites between adult quail groups hatched at different incubation temperatures. A 7-fold cross-validation and 200 permutation tests were performed to verify the model’s reliability (Appendix Fig. S2). The Variable Projection Importance (VIP) in PLS-DA was used to identify metabolites that contributed significantly to group differences (Wone et al., 2011). Metabolites with VIP >1.0 were considered potentially important. Between-group comparisons were conducted using the Independent T-test. Metabolites with P-values < 0.05, VIP > 1, FC > 1.2, or FC < 0.833 were identified as differential metabolites. Metabolic pathways for compounds were obtained from the Kyoto Encyclopedia of Genes and Genomes (KEGG) database.
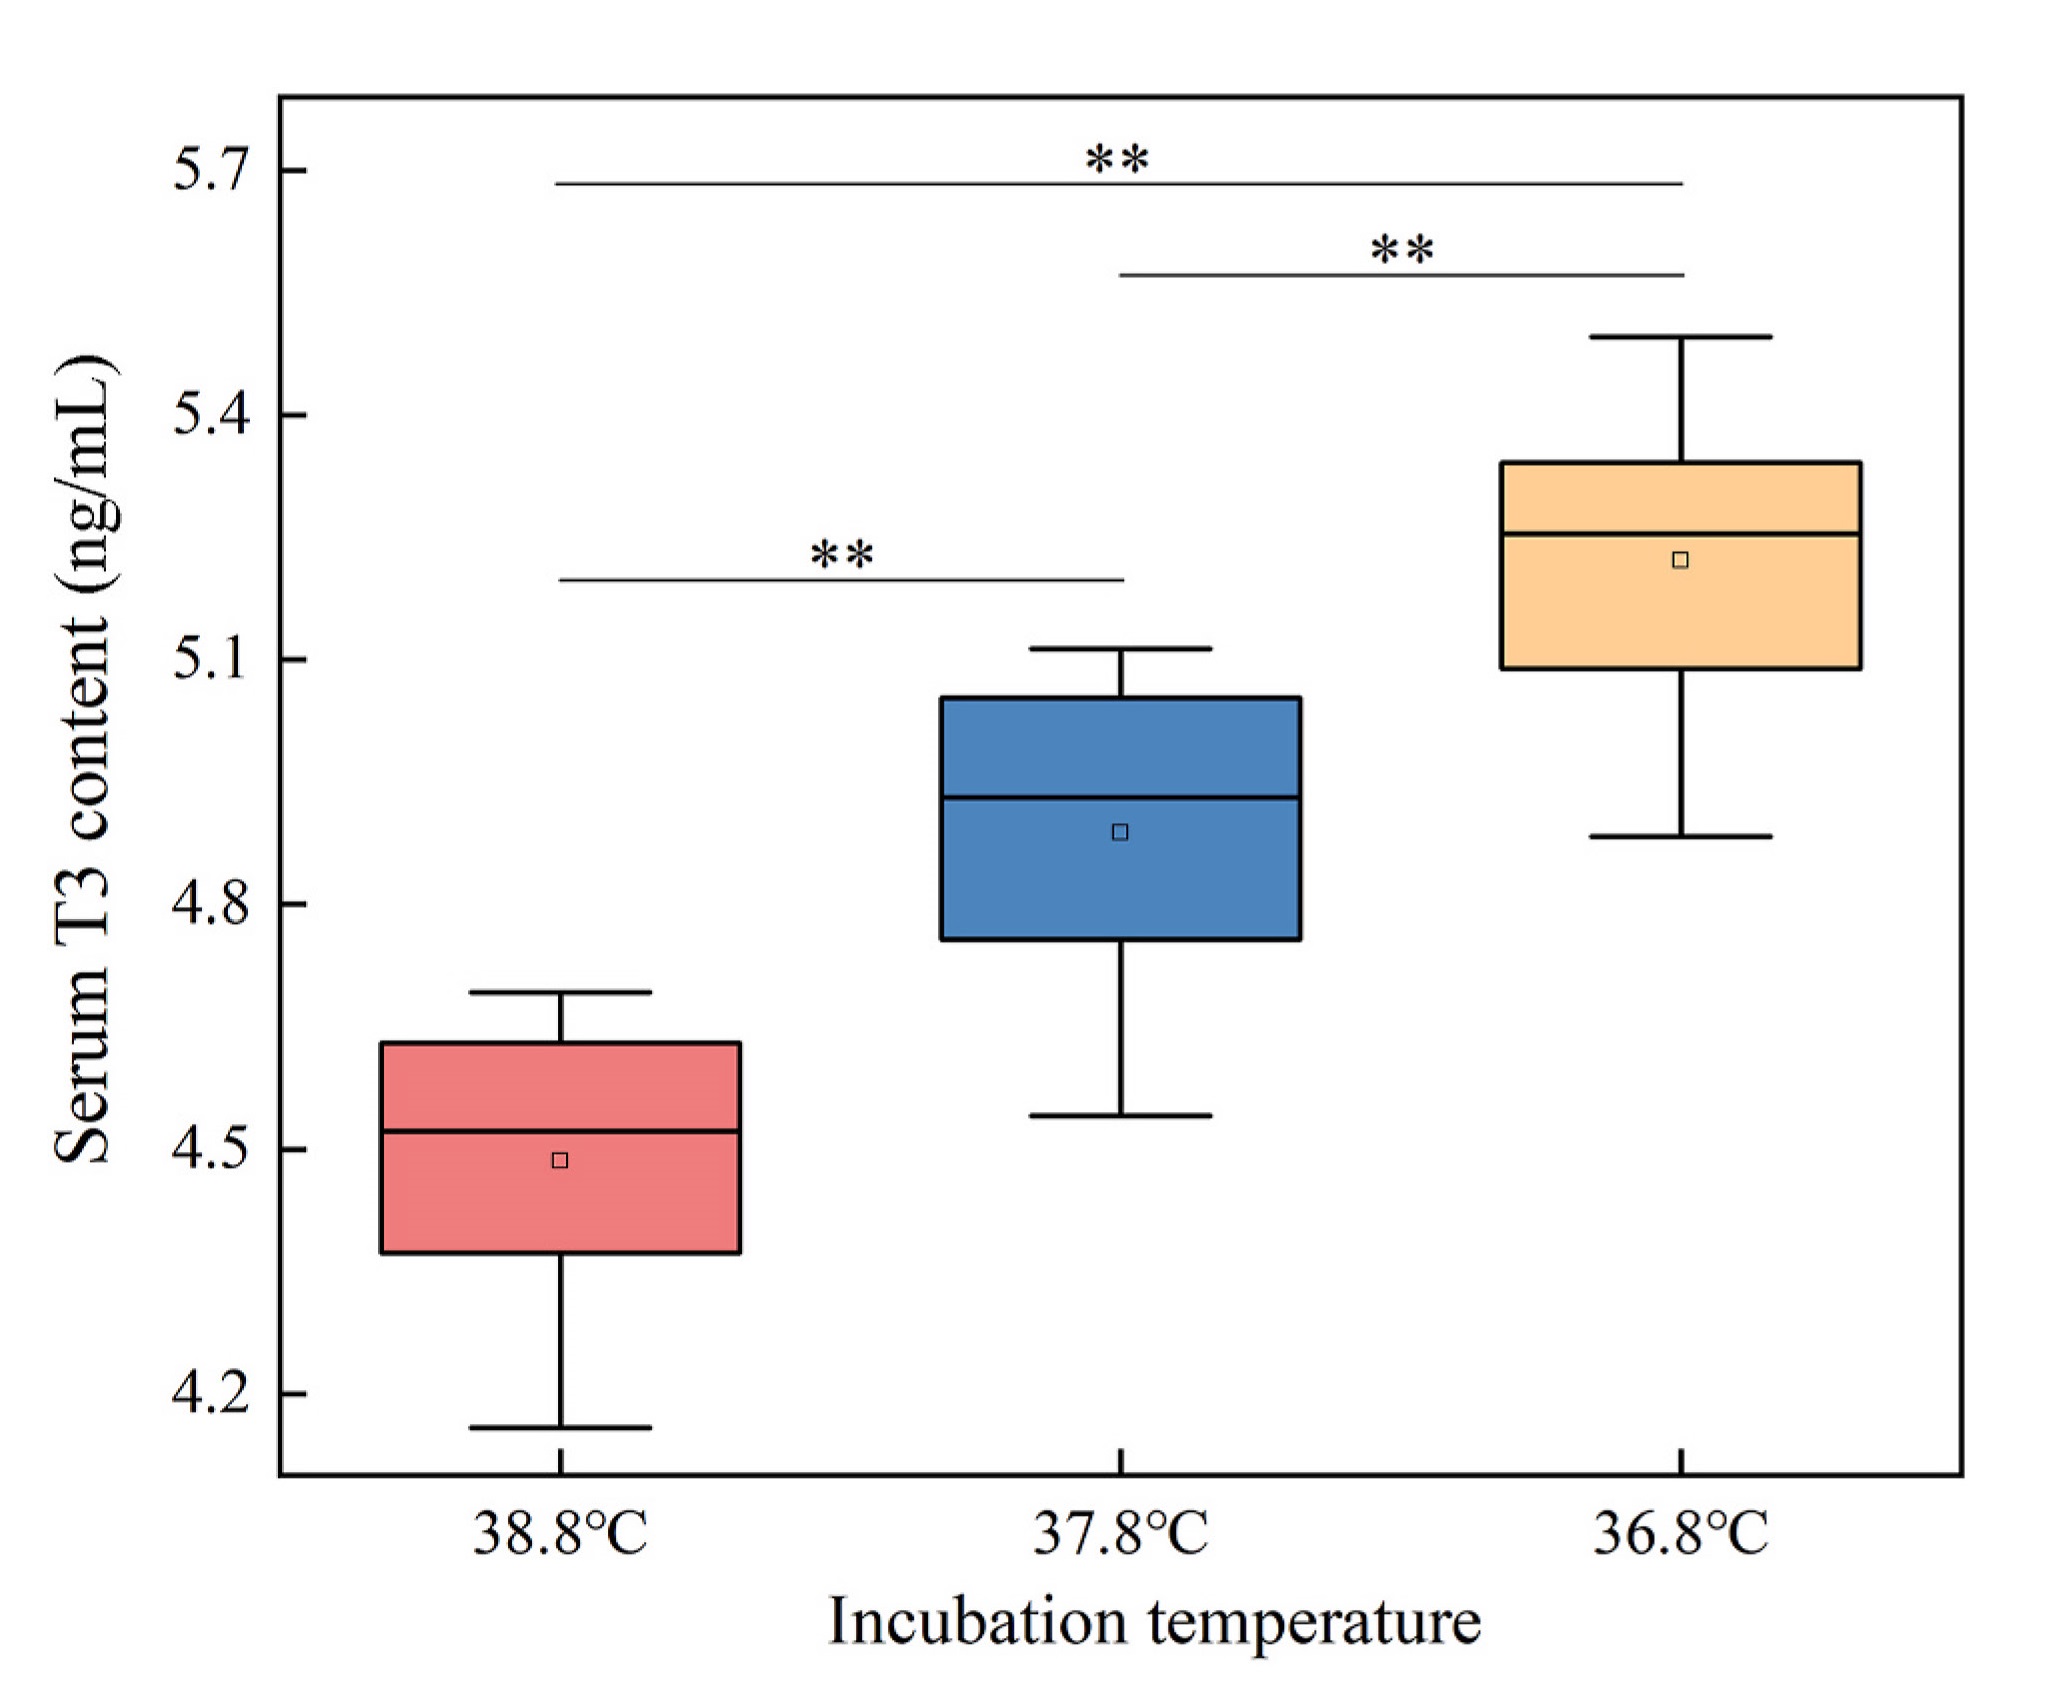
The result of linear mixed model for serum T3 level shows that incubation temperature significantly influenced the serum T3 levels of quails (Table 1). The serum T3 level was significantly different between the incubation temperature groups at 0 ℃ (one-way ANOVA, F2,33 = 52.480, P < 0.01). The level in 38.8 ℃ group was significantly lower than those in 37.8 ℃ and 36.8 ℃ groups, and the level in 36.8 ℃ group was significantly higher than those in 37.8 ℃ group (LSD test, P < 0.01) (Fig. 2).
| Response variable | Explanatory variable | F | P |
| Serum T3 | Incubation temperature | 49.467 | <0.010 |
| Body mass | 0.061 | 0.807 | |
| Sex | 0.143 | 0.708 | |
| Incubation temperature×body mass | 0.149 | 0.862 | |
| Incubation temperature×sex | 0.088 | 0.916 | |
| Metabolic rate | Incubation temperature | 4.465 | <0.050 |
| Body mass | 0.134 | 0.718 | |
| Sex | 0.946 | 0.343 | |
| Incubation temperature×body mass | 0.412 | 0.669 | |
| Incubation temperature×sex | 2.189 | 0.147 |
 DownLoad:
CSV
DownLoad:
CSV
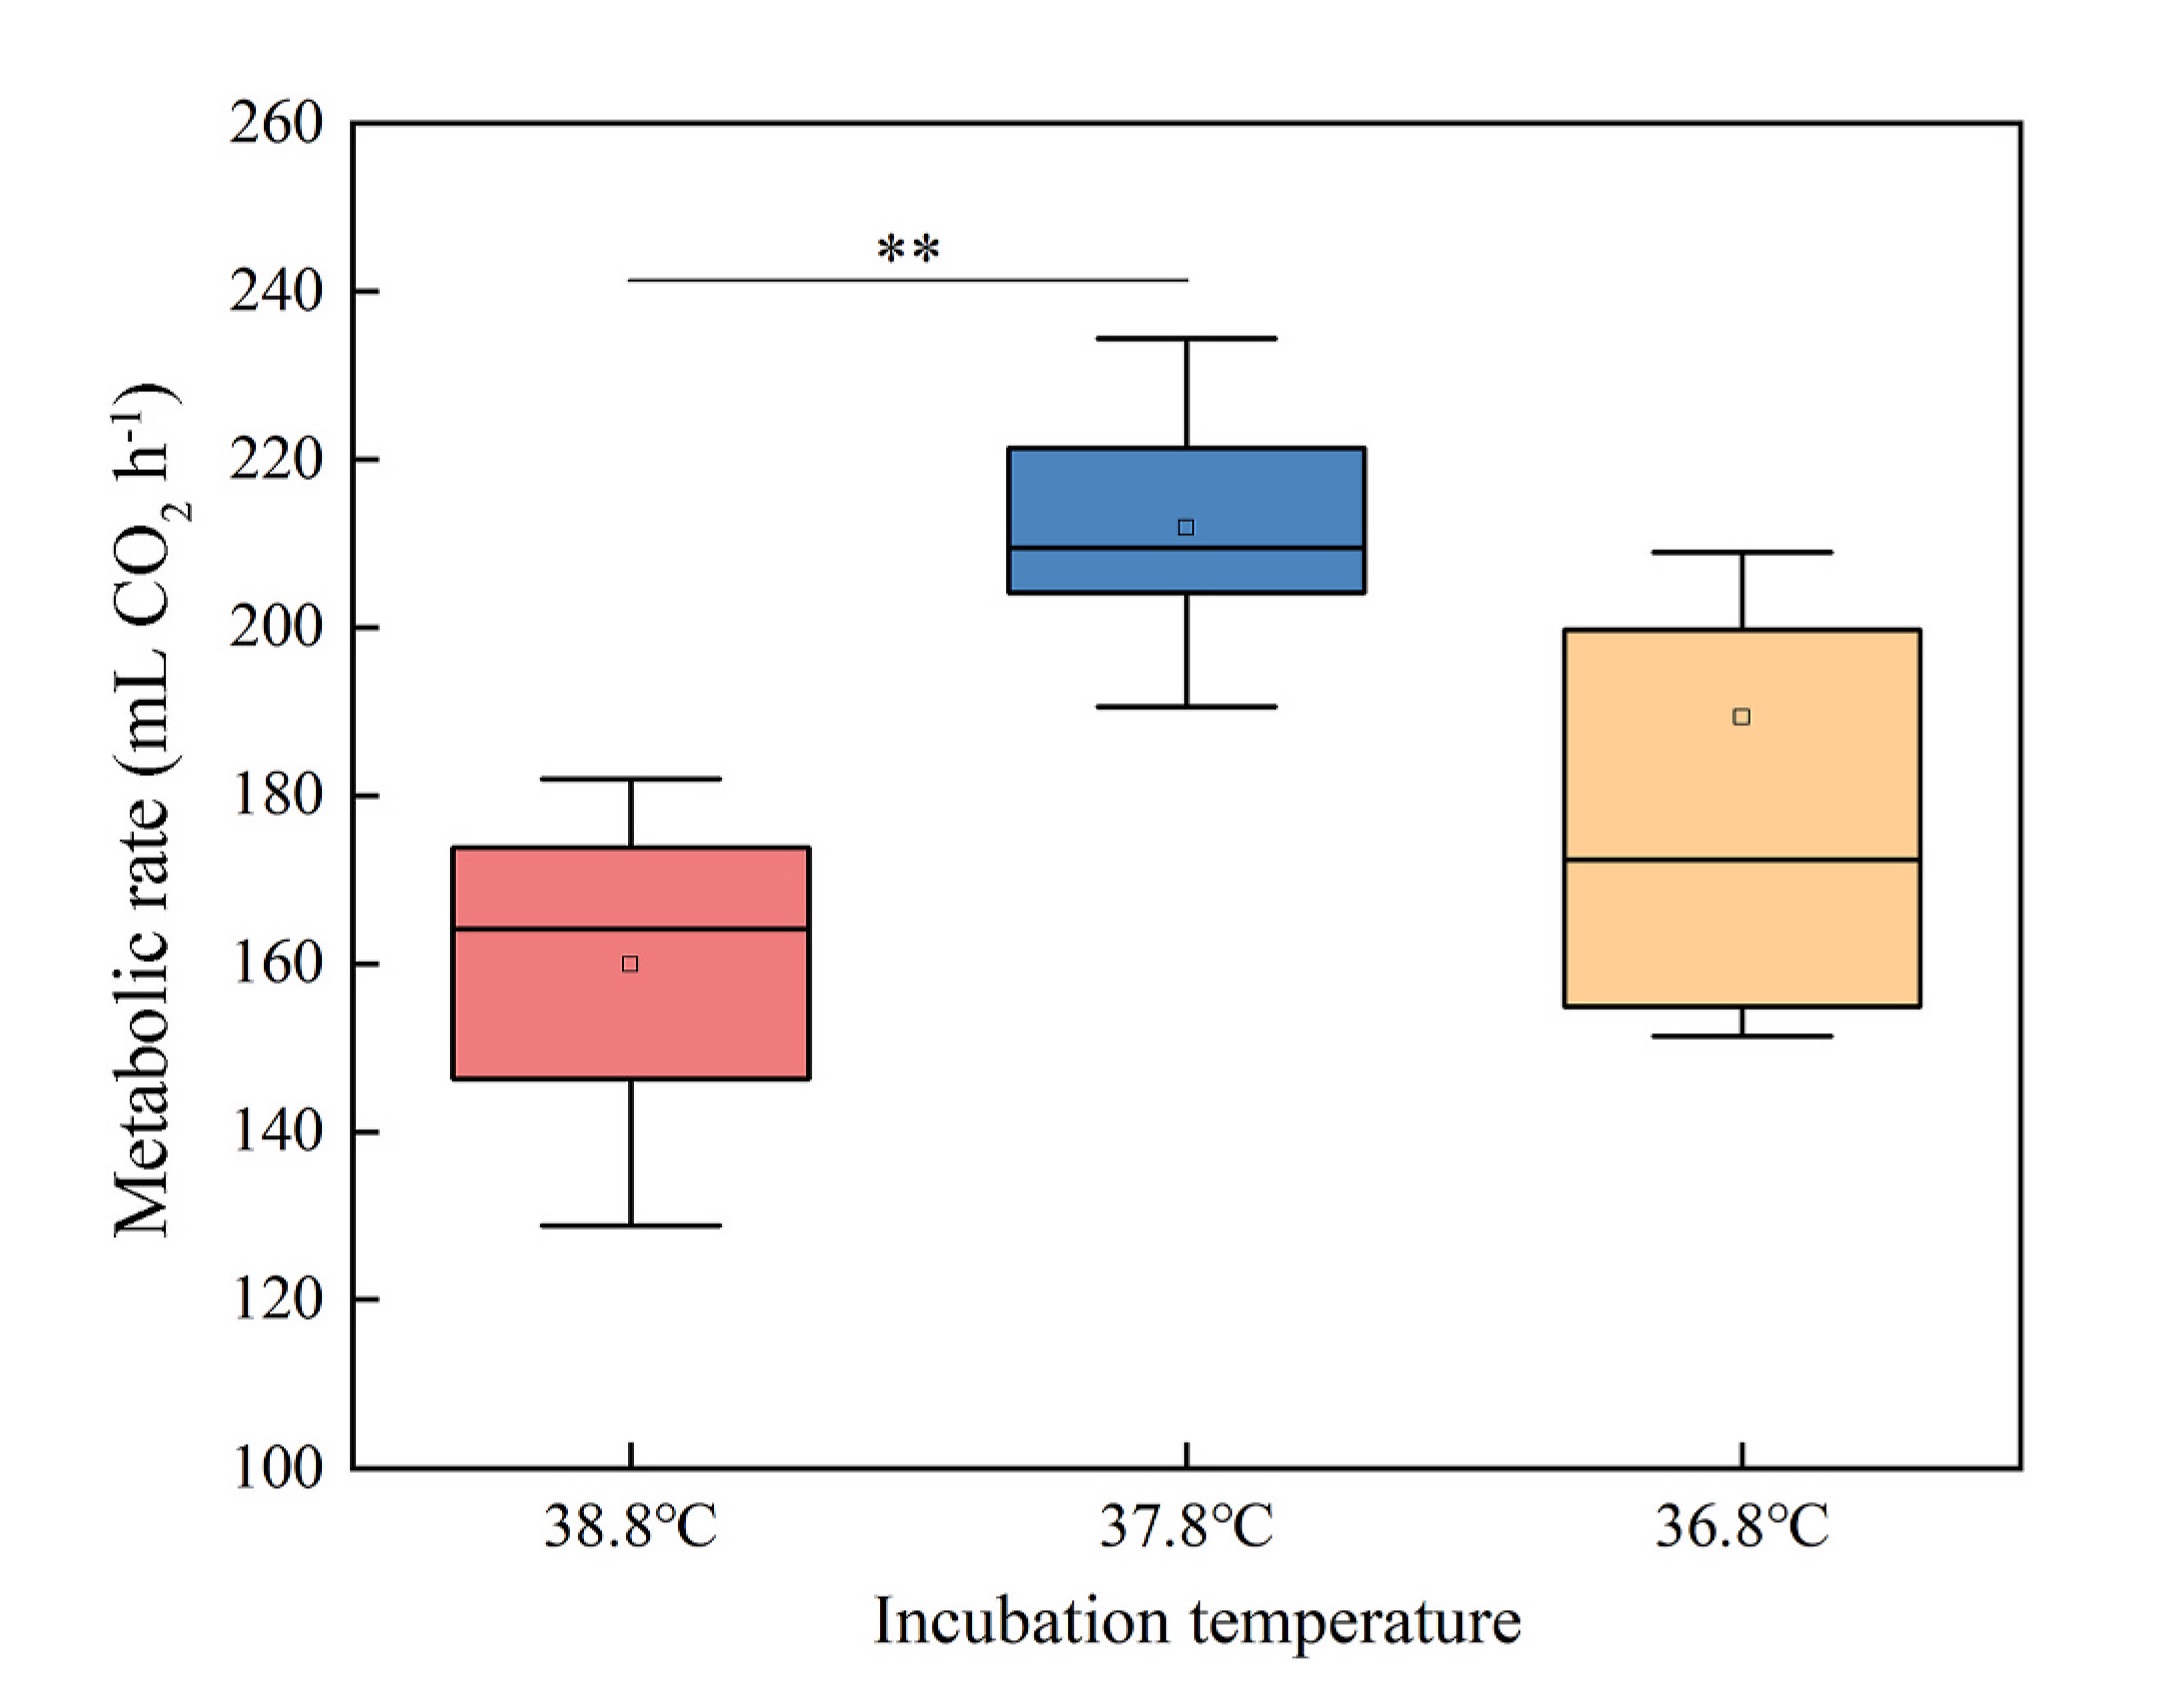
The result of linear mixed model for metabolic rate shows that incubation temperature significantly influenced the metabolic rate of the quails (Table 1). The metabolic rates at 0 ℃ were significantly different between the incubation temperature groups (one-way ANOVA, F2,21 = 4.307, P < 0.05). The metabolic rate in 38.8 ℃ group was significantly lower than that in 37.8 ℃ group, and there was no significant difference between 36.8 ℃ group and 37.8 ℃ group (LSD test, P < 0.01) (Fig. 3).
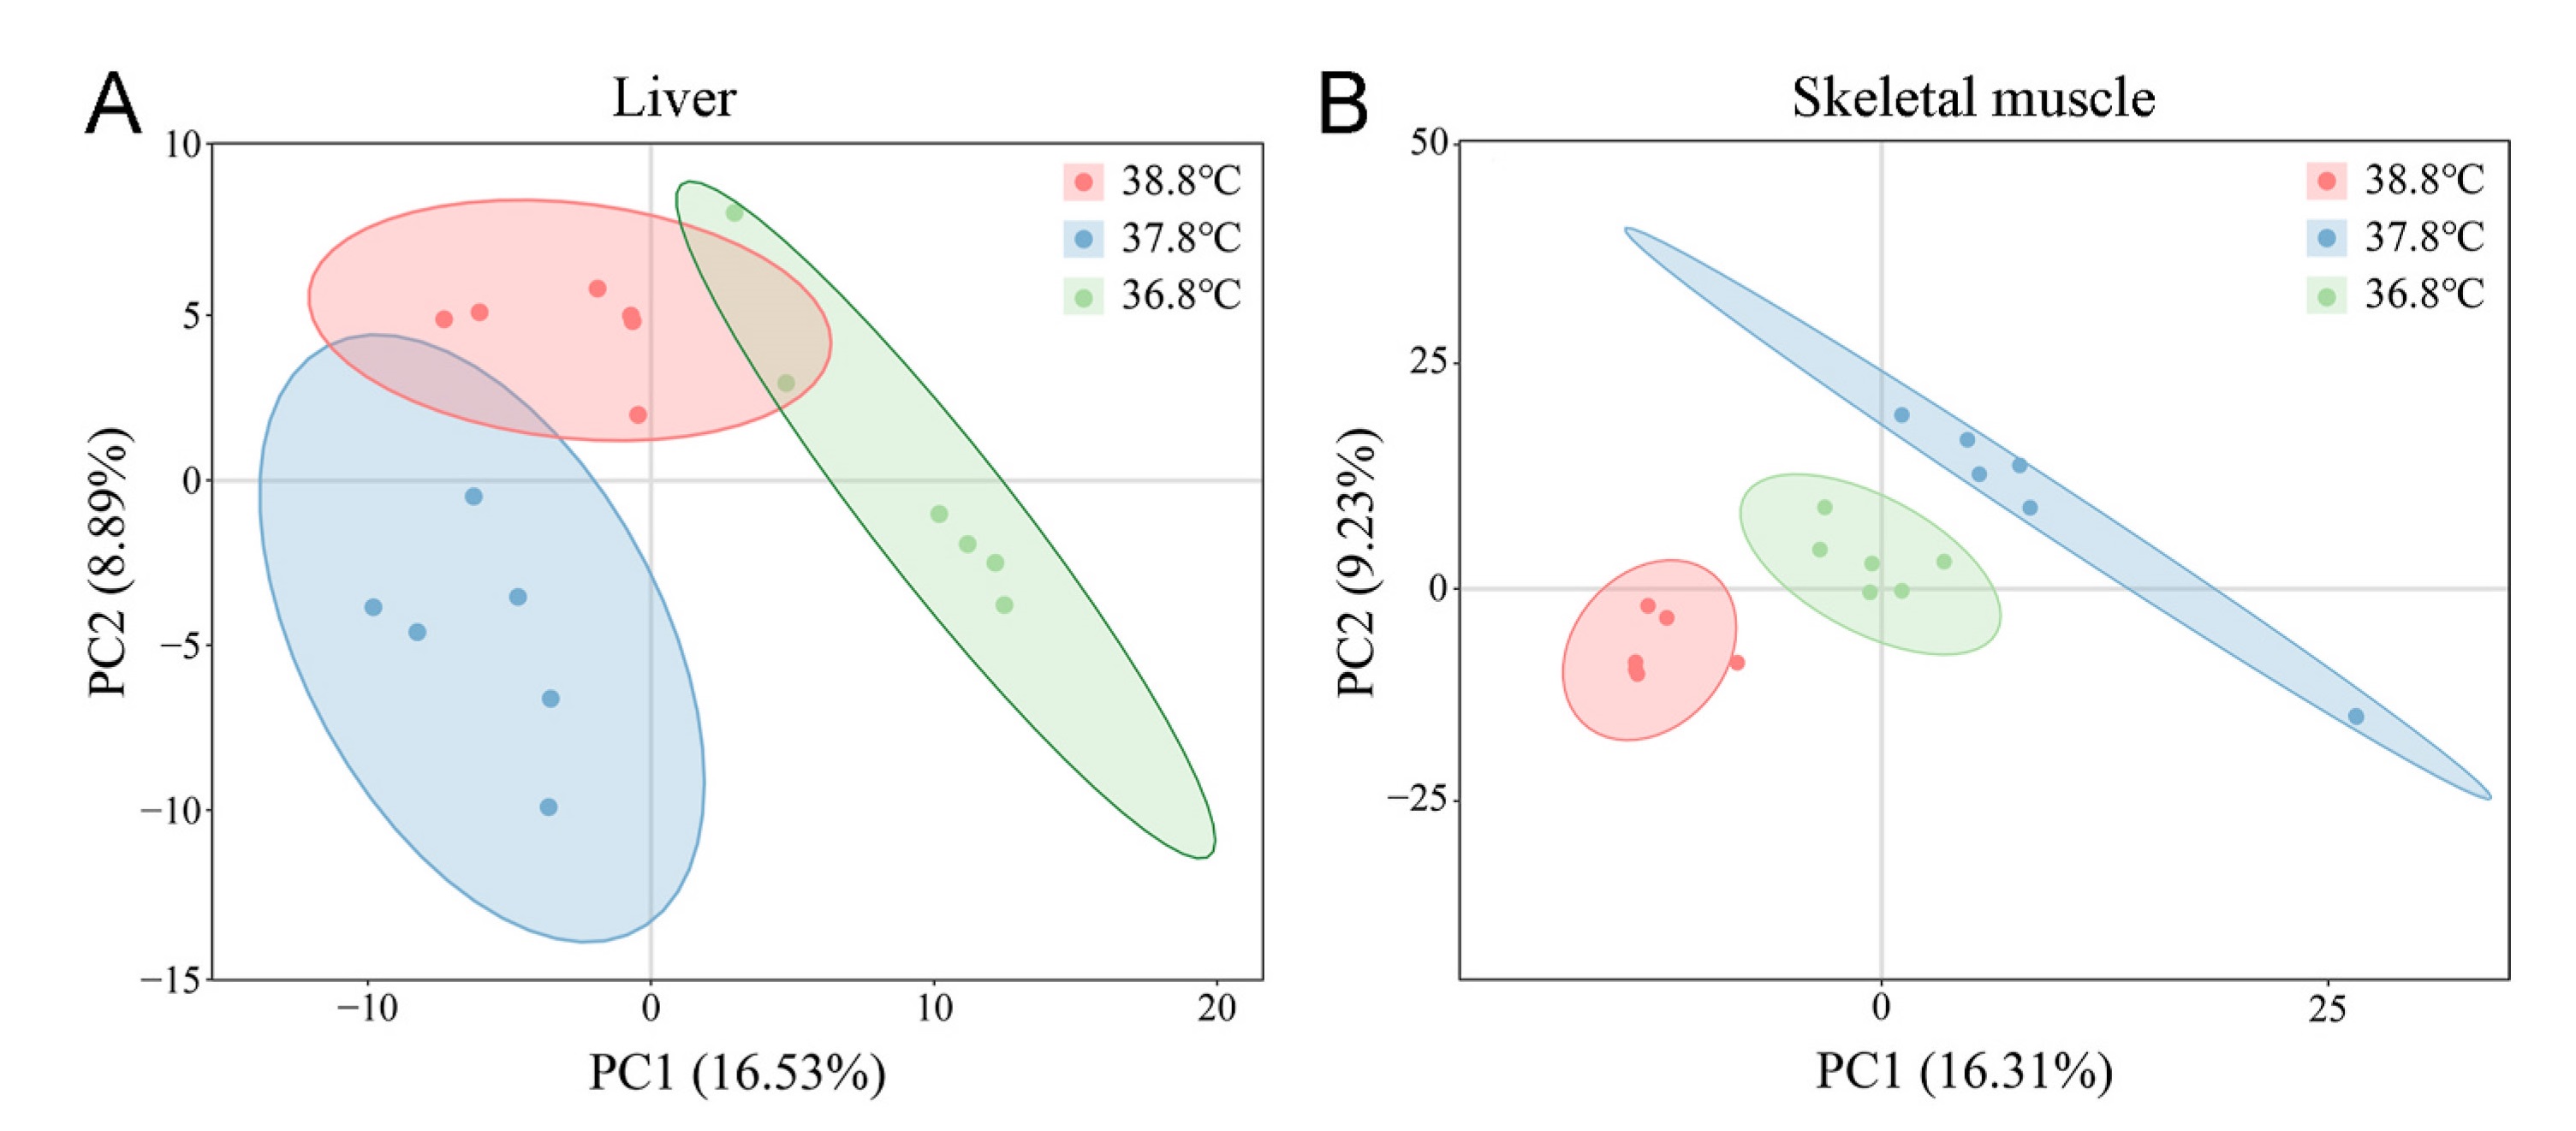
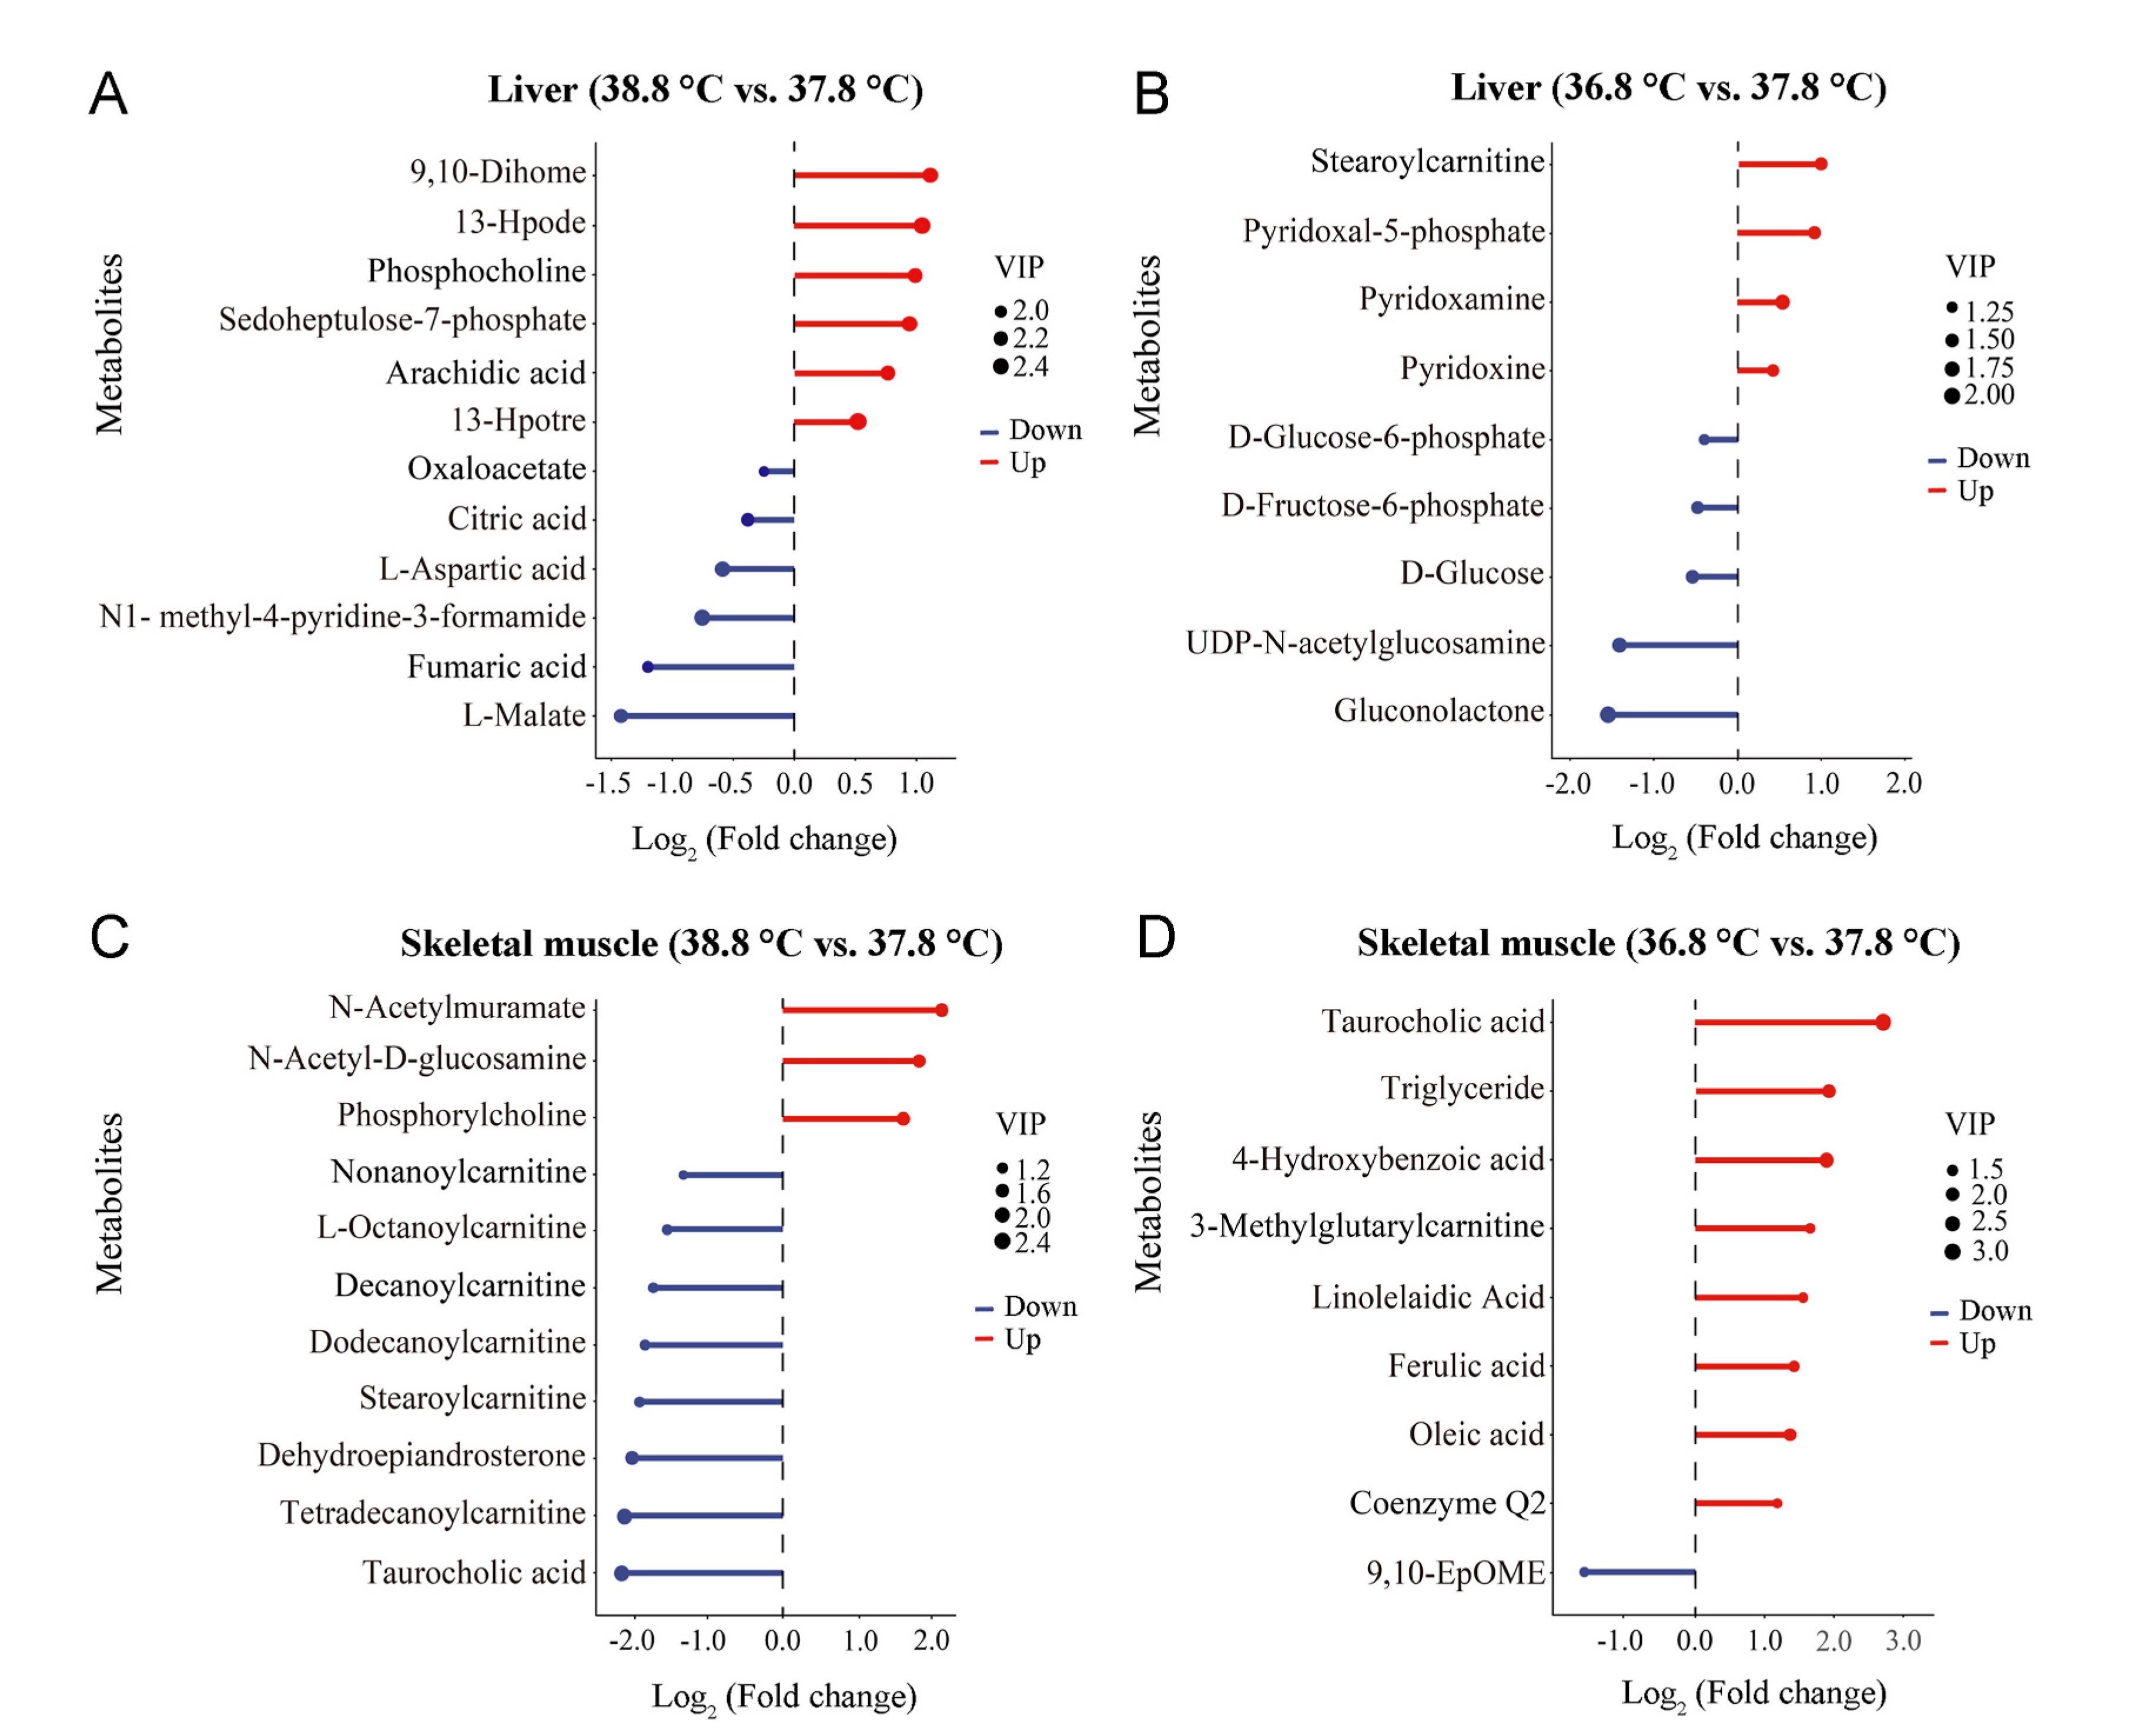
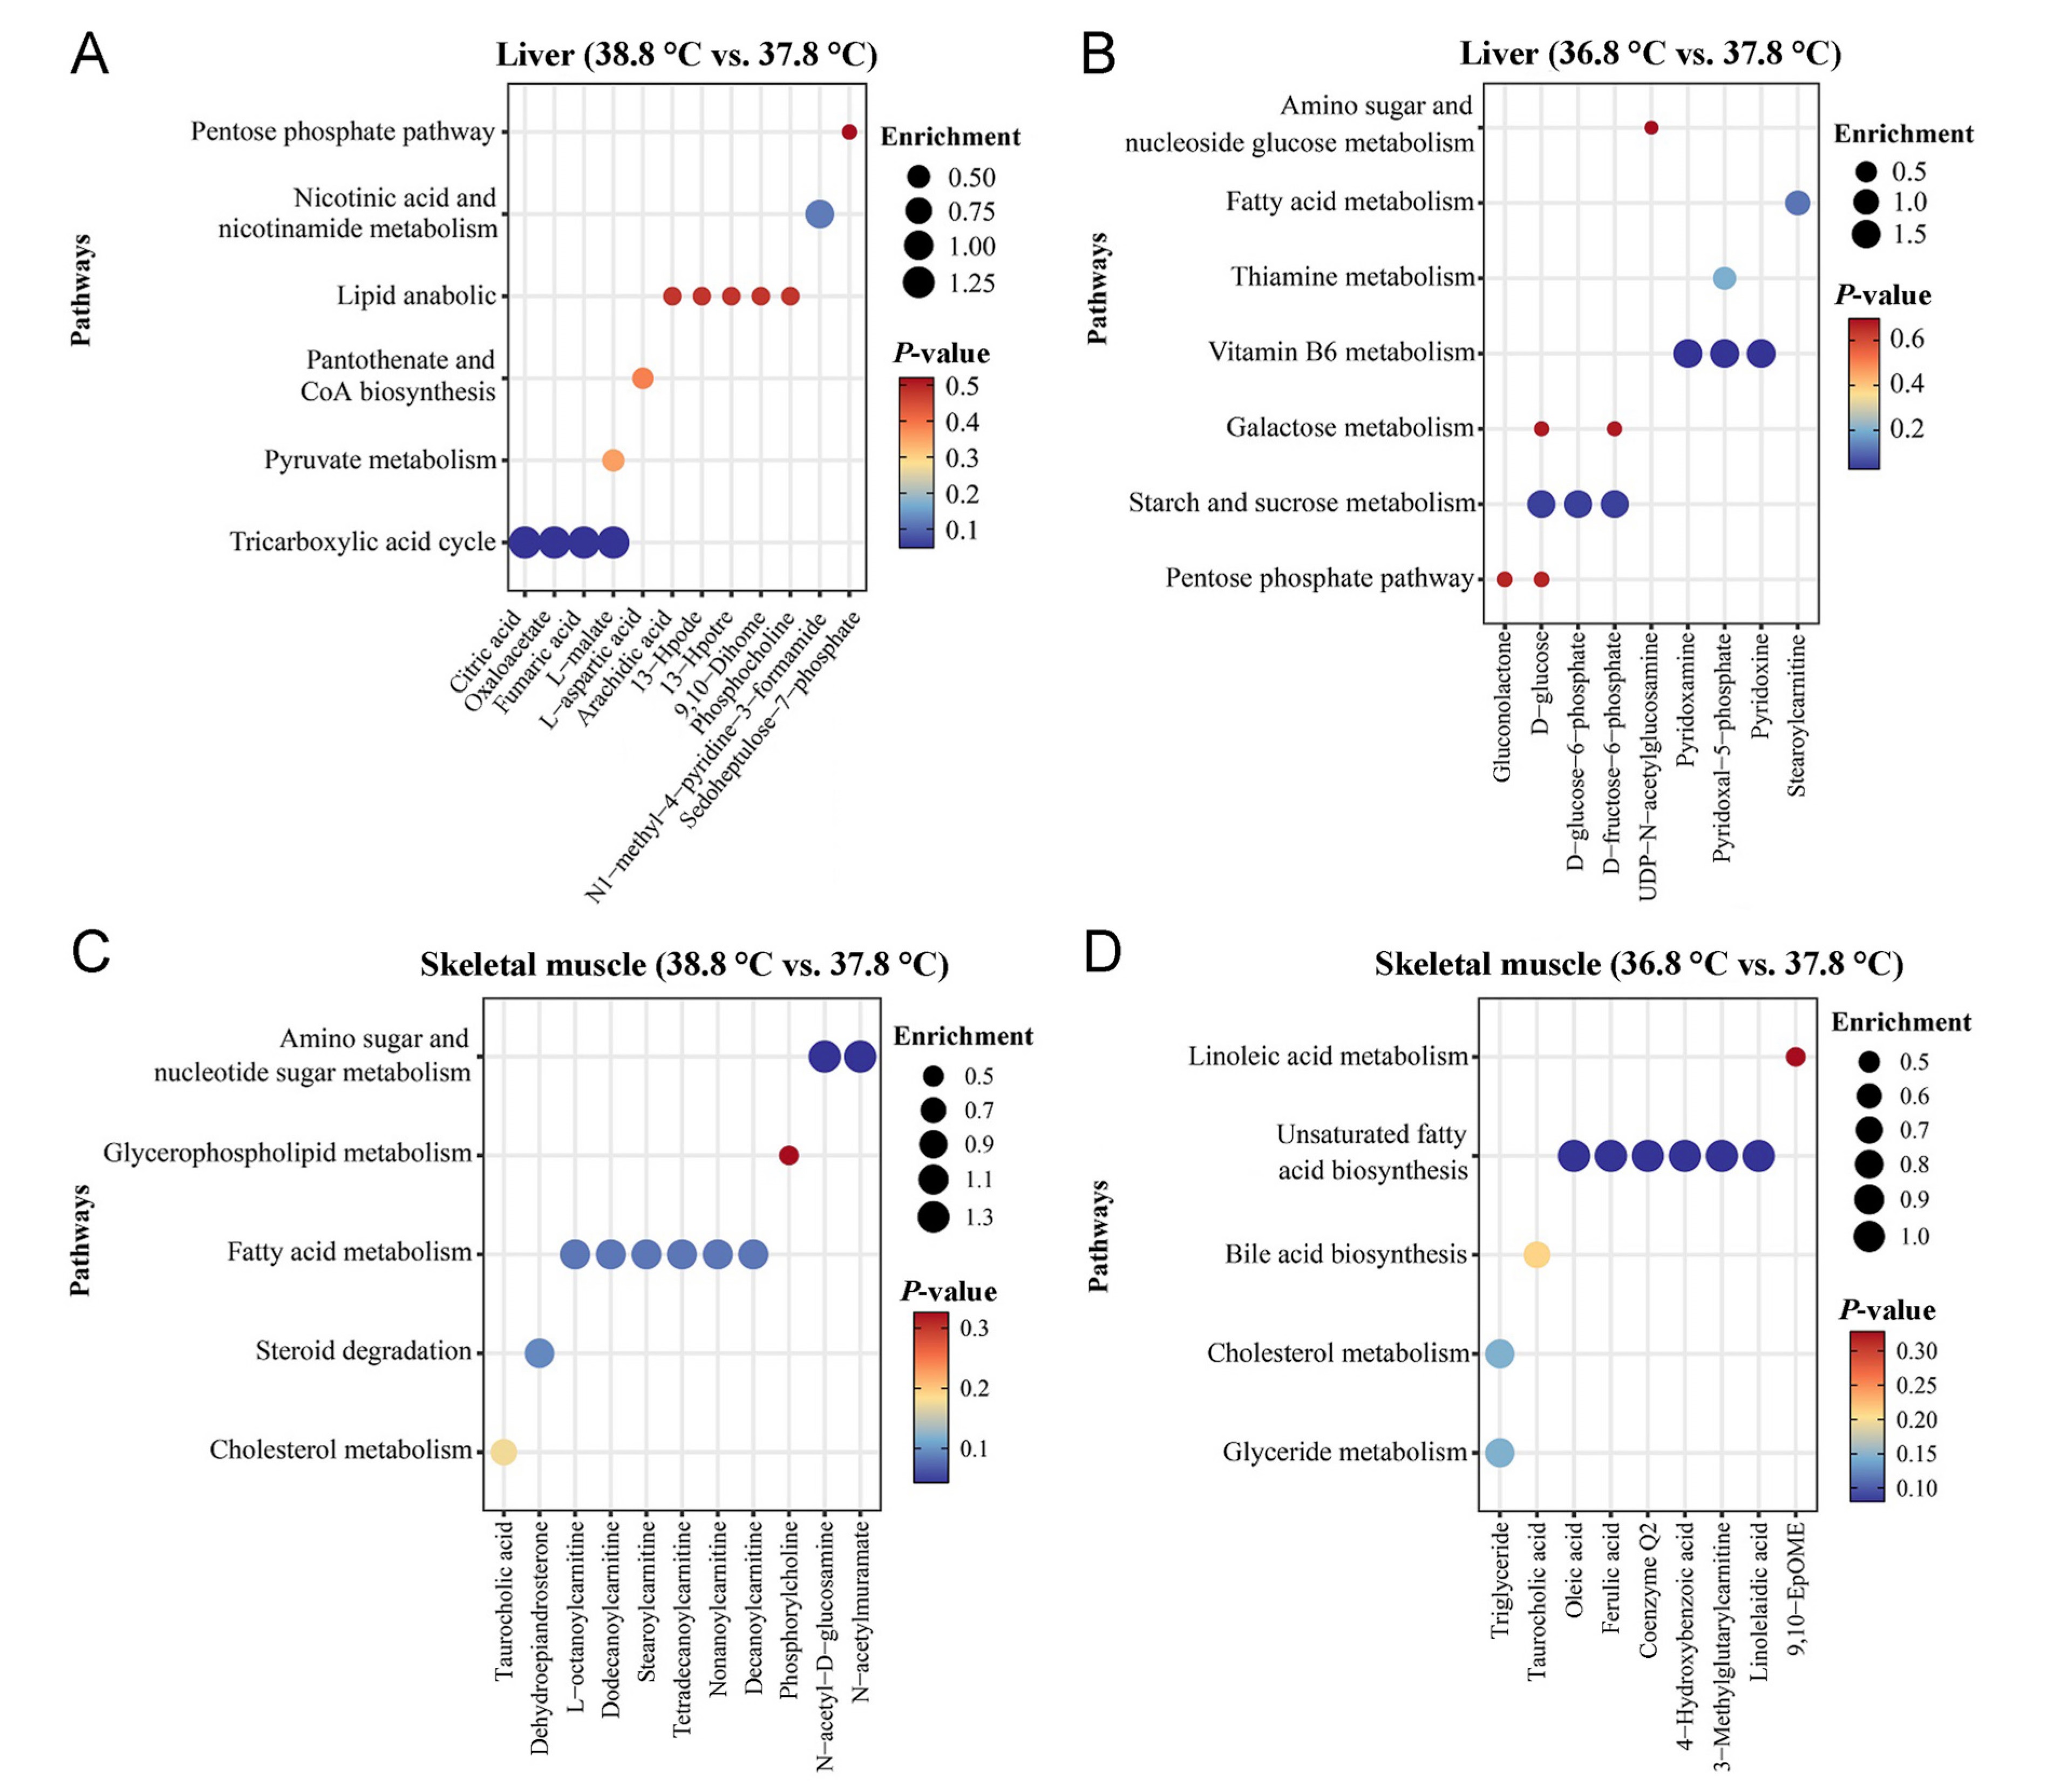
The detection results of three QC samples indicate that the detection system was suitable for the analysis of the samples in this study (Appendix Fig. S2). The results of PLS-DA analysis showed significant differences in the liver (R2Y = 0.924; Fig. 4A, Appendix Fig. S3A) and muscle (R2Y = 0.964; Fig. 4B, Appendix Fig. S3B) metabolites between the three incubation temperature groups. In the liver tissue, 12 metabolites involved in cellular oxidative catabolism and coenzyme synthesis were significantly different between the 38.8 ℃ and 37.8 ℃ incubation groups (P < 0.05 and VIP > 1, FC > 1.2 or FC < 0.833) (Fig. 5A and 6A). Nine metabolites involved in cellular oxidative catabolism and coenzyme synthesis were significantly different between the 36.8 ℃ and the 37.8 ℃ groups (P < 0.05 and VIP > 1, FC > 1.2 or FC < 0.833) (Fig. 5B and 6B). In the skeletal muscle tissue, 11 metabolites involved in lipid oxidation metabolism showed significant differences between the 38.8 ℃ and 37.8 ℃ incubation groups (P < 0.05 and VIP > 1, FC > 1.2 or FC < 0.833) (Fig. 5C and 6C). Nine metabolites involved in lipid oxidation metabolism and unsaturated fatty acid biosynthesis showed significant differences between the 36.8 ℃ and 37.8 ℃ groups (P < 0.05 and VIP > 1, FC > 1.2 or FC < 0.833) (Fig. 5D and 6D).
In this study, when the quails were exposed to 0 ℃, the serum T3 levels of individuals hatched at 38.8 ℃ were significantly lower than those hatched at 37.8 ℃ and 36.8 ℃, indicating that individuals hatched at high temperatures had reduced ability to secrete T3 in cold environments. Individuals incubated at 36.8 ℃ had a higher ability to secrete T3. When birds are exposed to cold environments, deiodinase (DIO) in the liver catalyzes the conversion of T4 to T3, leading to an increase in T3 levels in peripheral blood (Nassar et al., 2015). Elevating incubation temperature by 1 ℃ for 2 h daily in eggs reduces the level of thyroxine and the expression of DIO in the liver of chicks after hatching (Nassar et al., 2015). Therefore, lower T3 levels in individuals incubated at 38.8 ℃ may be attributed to reduced efficiency of the liver converting T4 to T3.
The results of metabolic rate of the quails showed that individuals incubated at 38.8 ℃ had lower metabolic rate responding to a decrease in ambient temperature. Previous research has shown that a higher incubation temperature leads to a lower basal metabolic rate in many bird species (Nord and Nilsson, 2011; Wada et al., 2015). A key finding of our study was that the metabolic rate reduction effect is maintained when the birds were exposed to 0 ℃ environment, which indicates that higher incubation temperature may lead to lower thermoregulatory capacity of birds in response to cold. The cold-induced metabolic rate of small birds is positively correlated with their survival rate during winter (Petit et al., 2017); thus, our result demonstrated that an increase of as little as 1 ℃ in incubation temperature could be detrimental to the survival of birds in winter. The result that hatching at 36.8 ℃ can result in a high metabolic rate indicates that a lower incubation temperature can improve an individual’s cold tolerance. However, studies have shown that lowering the incubation temperature from 37 ℃ to 35 ℃ can reduce low-temperature tolerance in quails within a week of hatching (Nord and Nilsson, 2021). Given the variation in thermoregulatory capacity caused by a 1 ℃ temperature change, incubation at 35 ℃ may result in a different thermogenesis phenotype than incubation at 36.7 ℃.
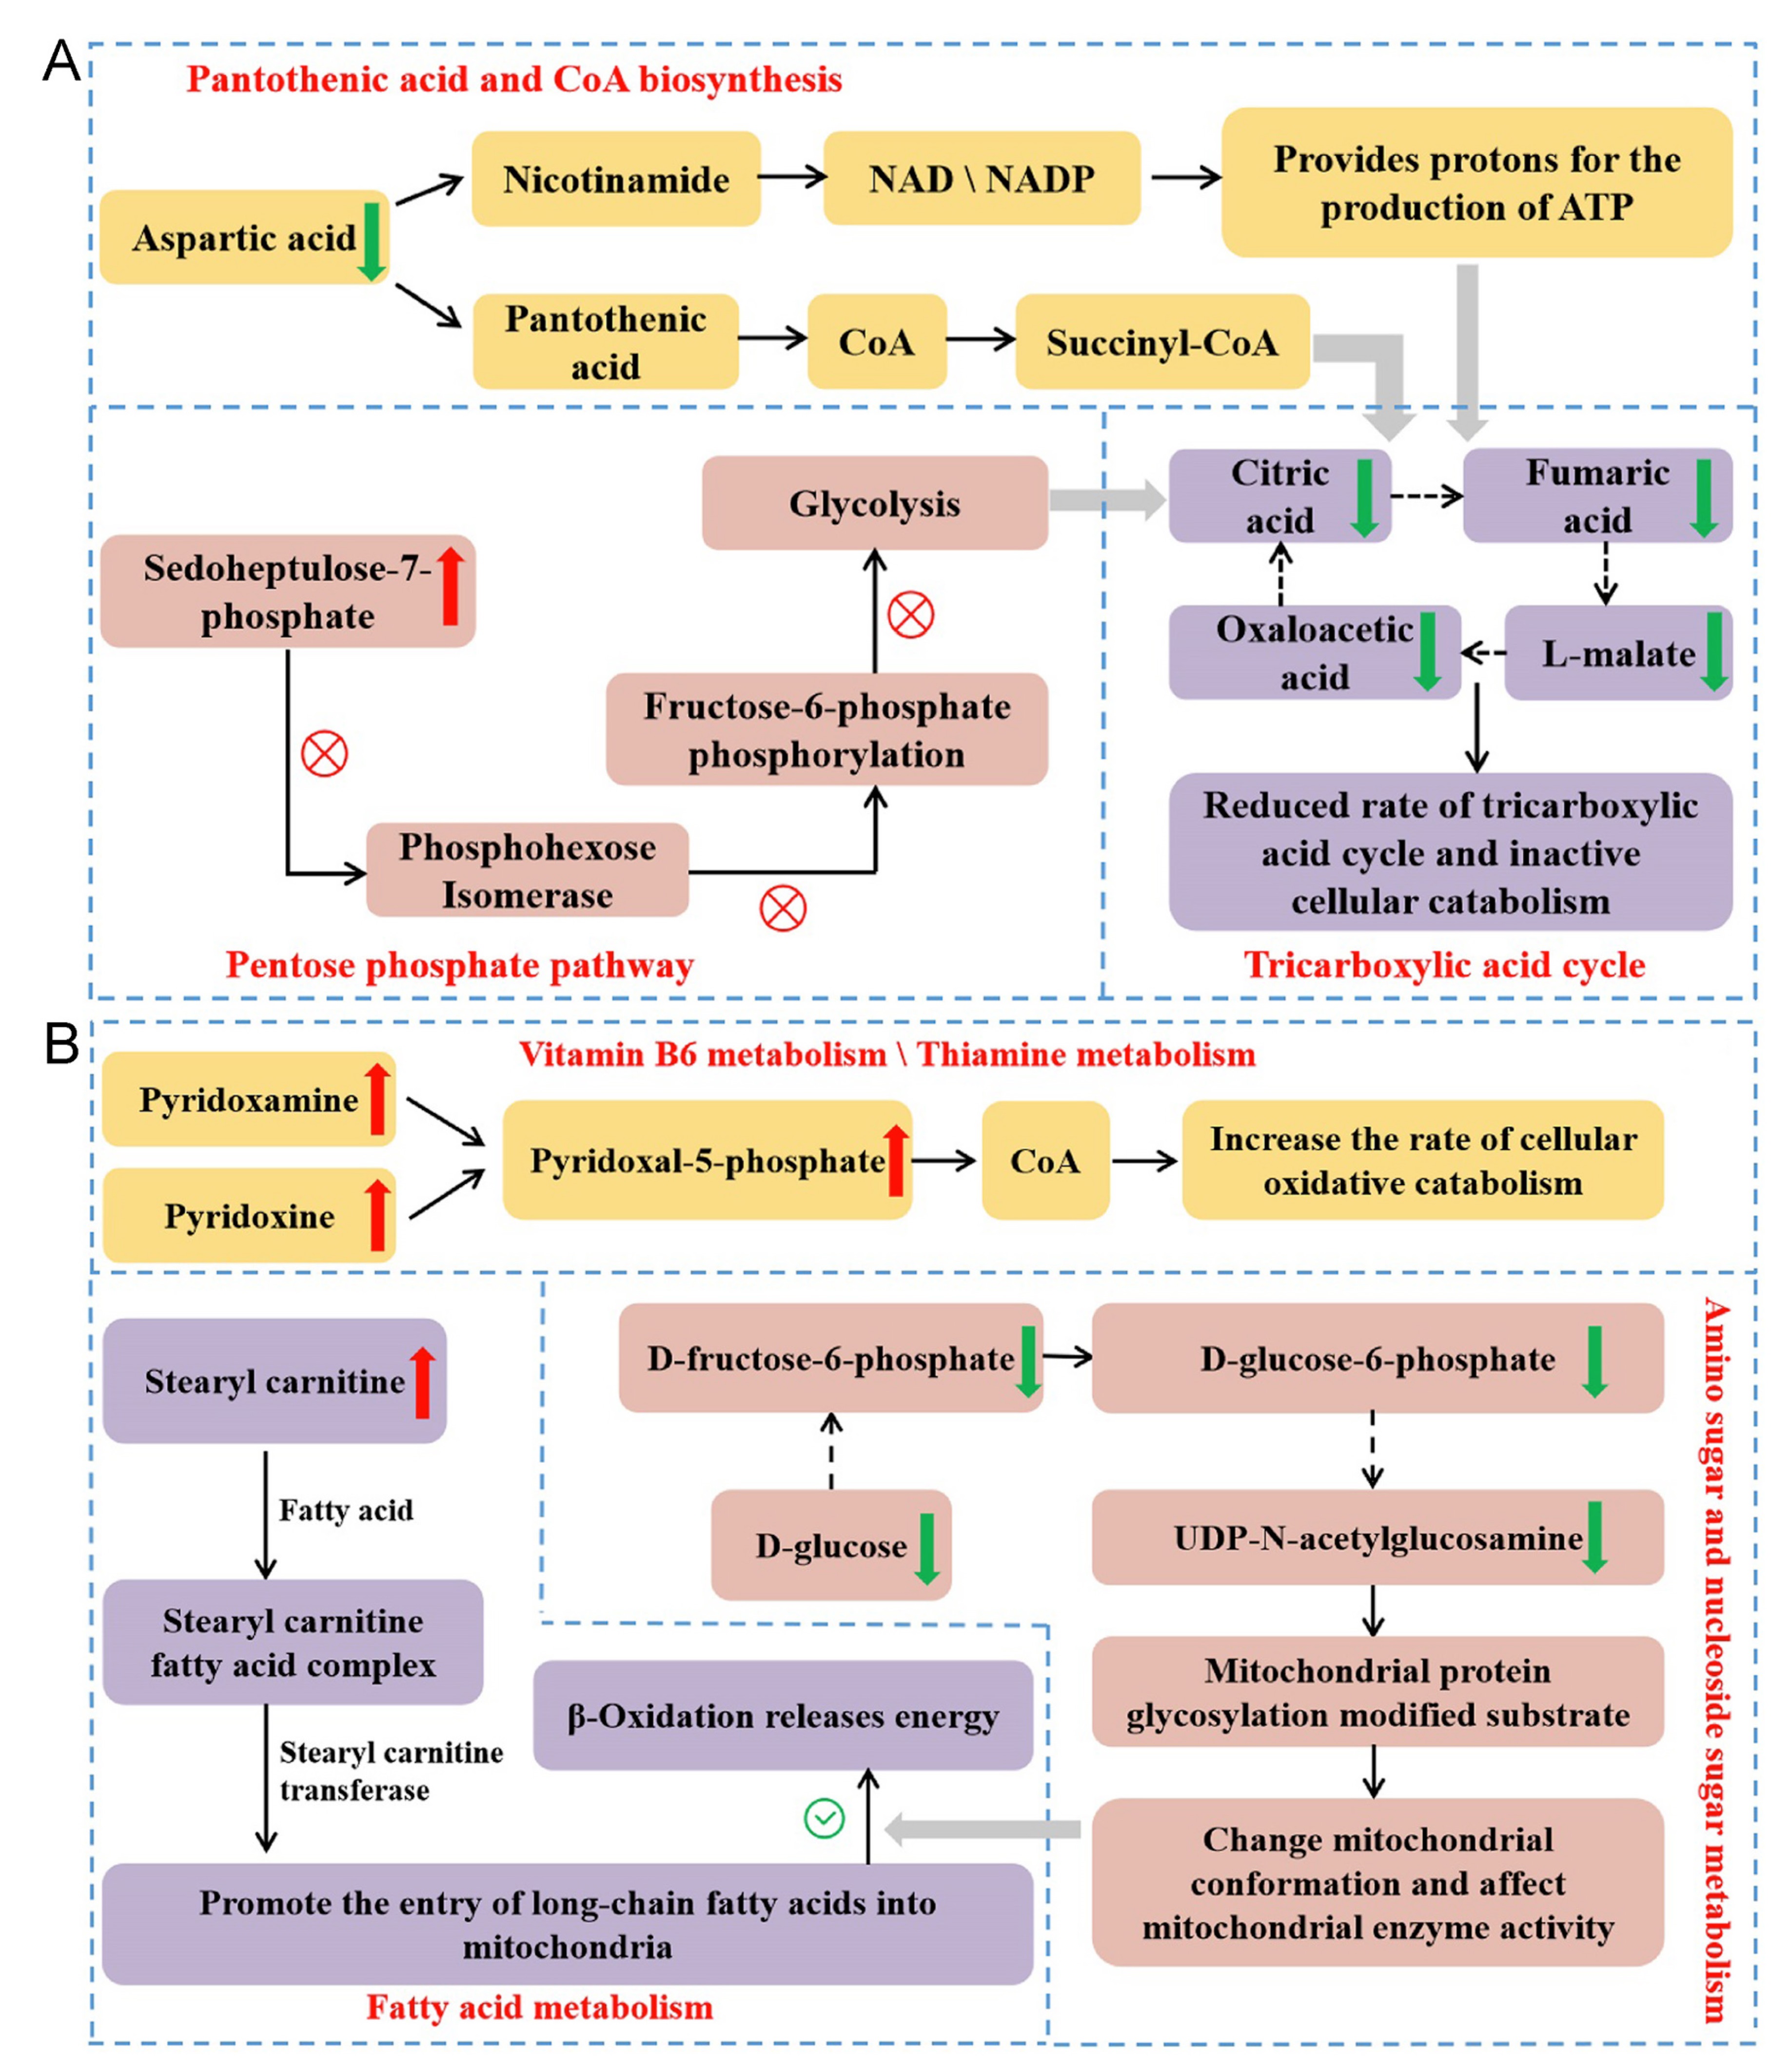
The results of differential metabolites analysis in liver show that individuals incubated at a higher temperature have lower rates of oxidative catabolism in the liver, while individuals incubated at lower temperatures show higher rates of carbohydrate oxidative metabolism. Comparing to the 37.8 ℃ group, tricarboxylic acid cycle, glycolysis, oxidative phosphorylation and lipid decomposition of the birds in 38.8 ℃ group are less active, and levels of coenzymes involved in oxidative decomposition in these birds are lower. Comparing to the 37.8 ℃ group, glucose oxidative decomposition, fatty acid oxidative metabolism and the biosynthesis of the coenzymes involved in catalyzing oxidative decomposition of the birds in the 36.8 ℃ are more active. The pathways of the differential metabolites involved in and their functions are summarized in Fig. 7 according to the available studies (Agius et al., 2002; Depeint et al., 2006; Nagy and Haschemi, 2013; Martin et al., 2016; Longo et al., 2016; Kirkland and Meyer Ficca, 2018; Tao et al., 2020; Caon et al., 2021; Faizo et al., 2021; Rossmann et al., 2022; Shiratori et al., 2023). The liver is an important obligatory thermogenic organ in birds (Paulusma et al., 2022), and the content of metabolites in the oxidative catabolic processes of the liver cells can reflect the liver’s thermogenic capacity (Trefts et al., 2017). The results of liver metabolome comparison are consistent with the variation in serum T3 levels found in this study, indicating that high-temperature incubation reduces thyroxine secretion and reduces cellular oxidative catabolic thermogenesis.


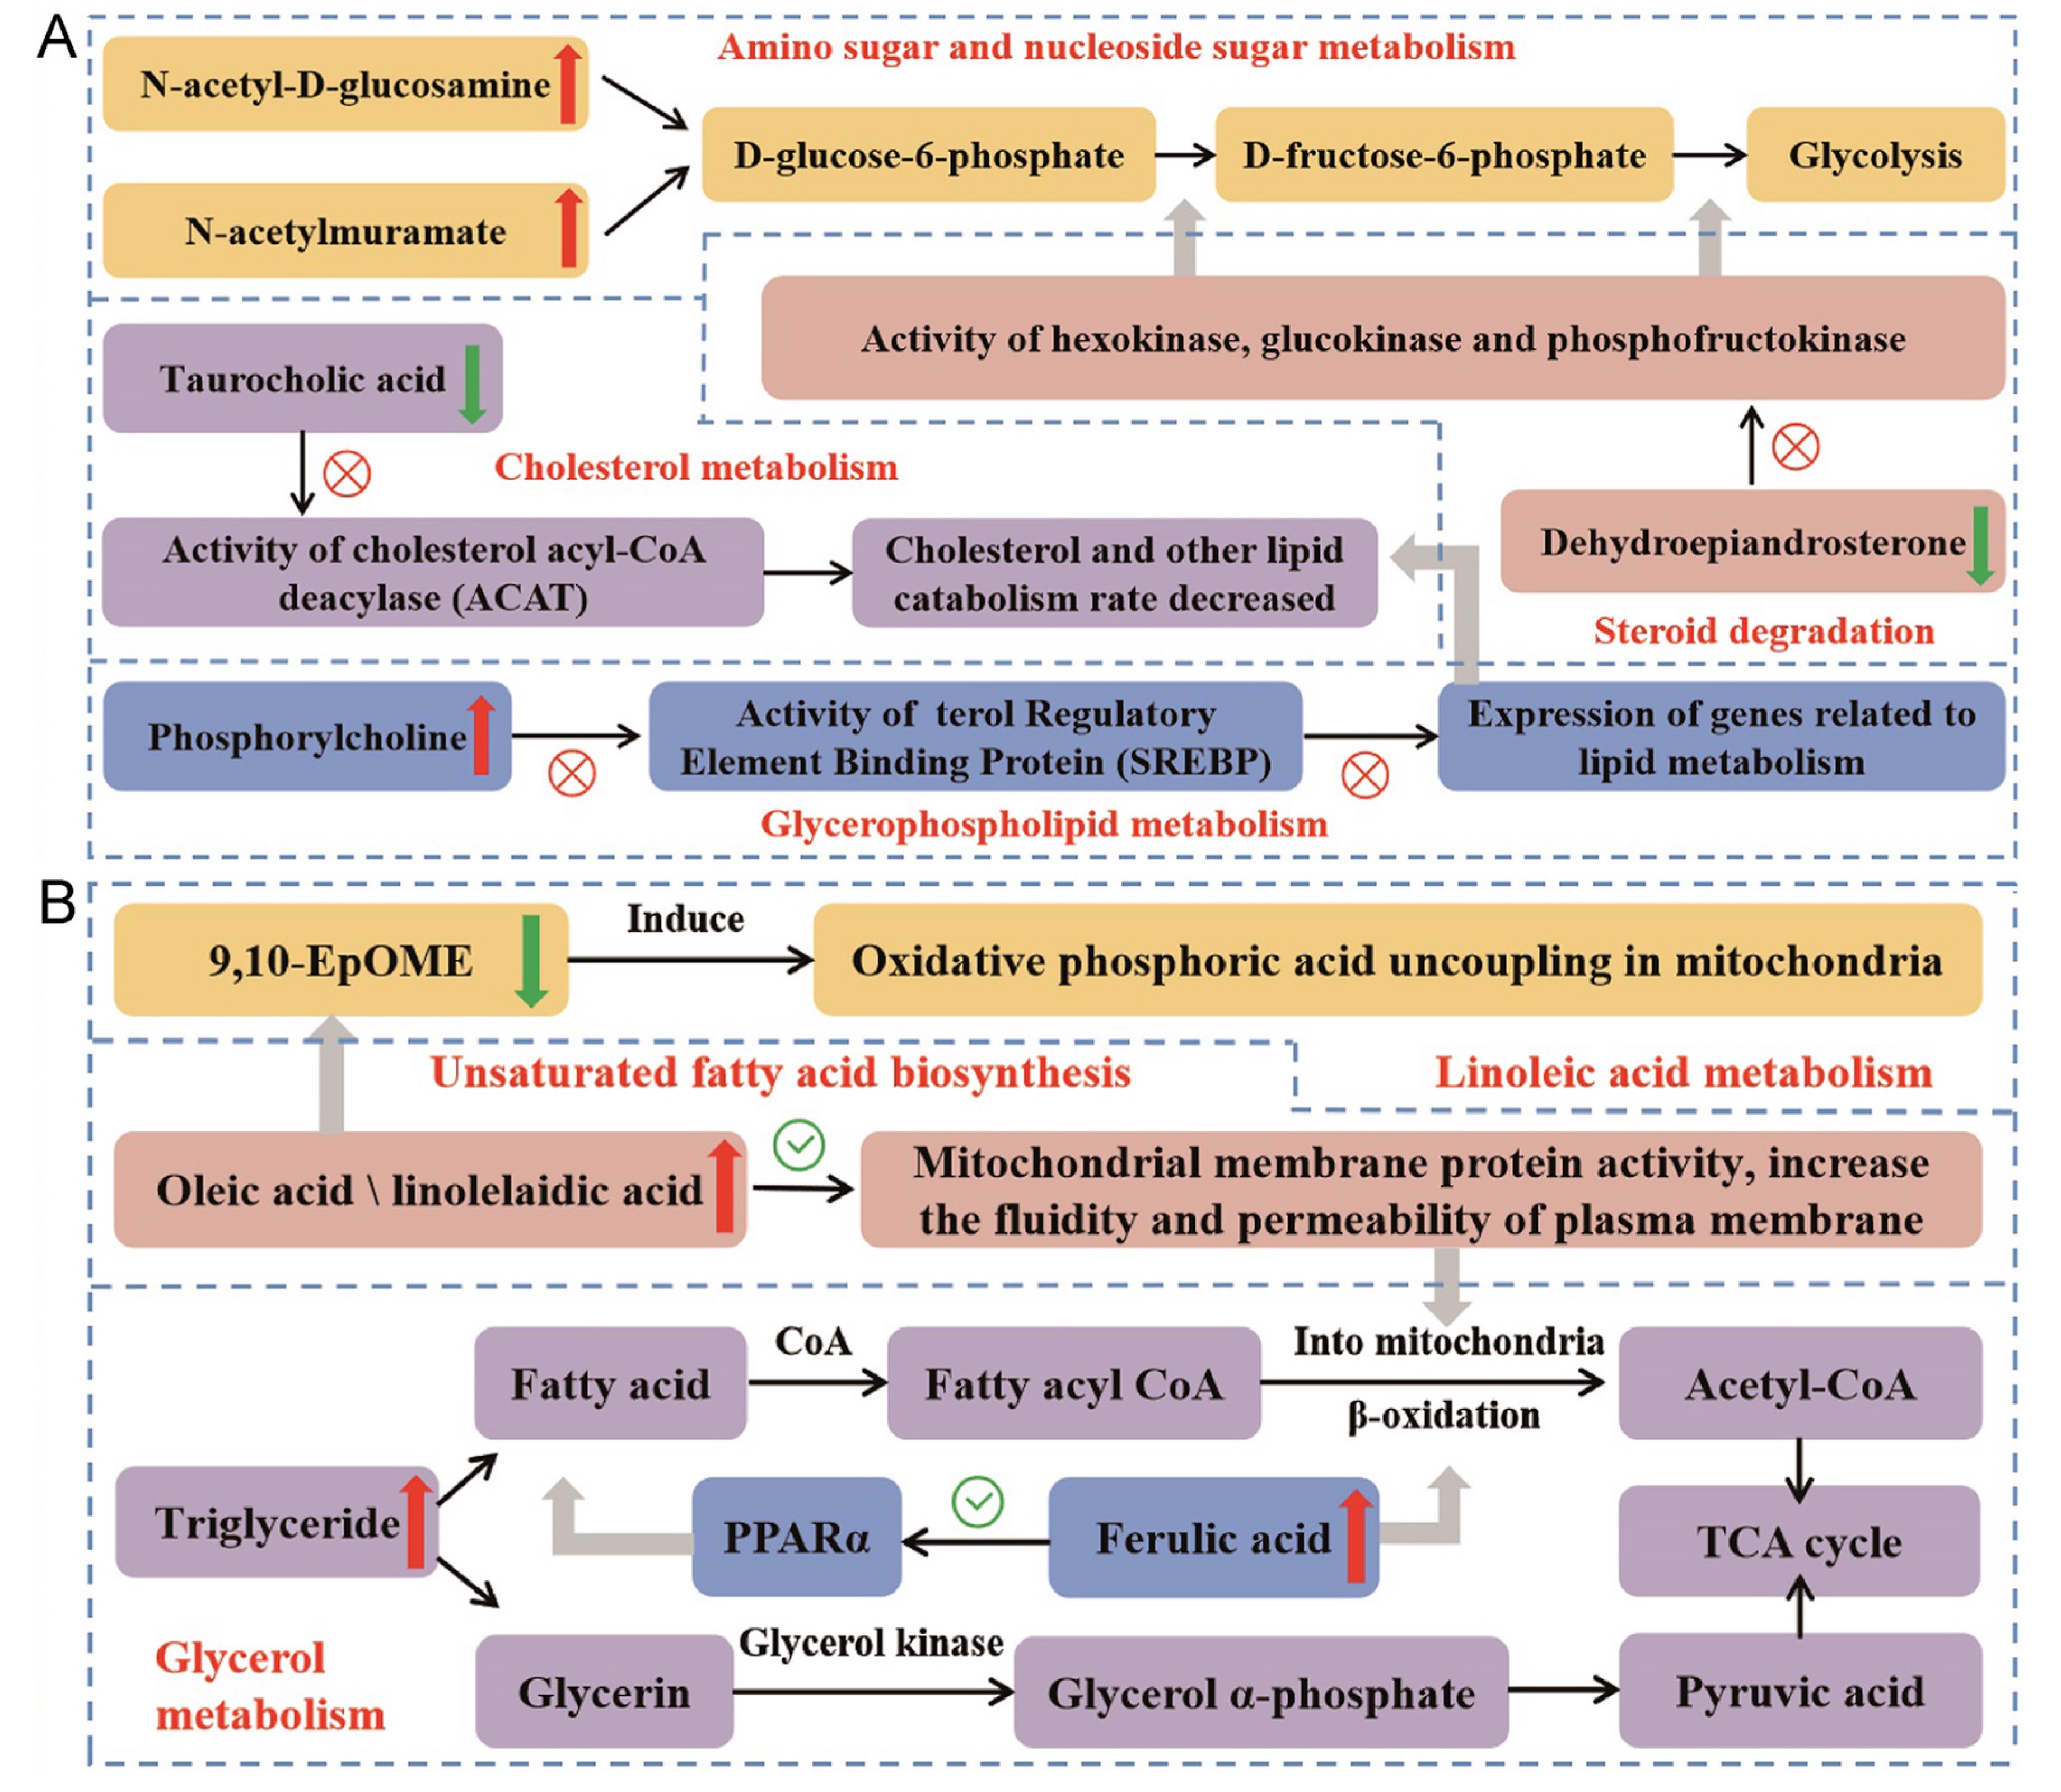
The results of differential metabolites analysis in skeletal muscle show that the activity of lipid oxidative catabolism in the skeletal muscle of quails hatched at higher temperatures is lower, whereas it is higher in quails hatched at lower temperatures. Comparing to the 37.8 ℃ group, the fatty acid and cholesterol decomposition, lipid synthesis, glucose metabolism of the birds in 38.8 ℃ group are inhibited, while the lipid decomposition is activated and membrane permeability increases in 36.8 ℃ group. The pathways of these differential metabolites involved in and their functions are summarized in Fig. 8 according to the available studies (Erickson and van Zuiden, 1995; Vaillancourt et al., 2005; Hulbert, 2008; Yadav et al., 2011; Longo et al., 2016; Van der Veen et al., 2017; Aoki and Terauchi, 2018; Hildreth et al., 2020; Pallotti et al., 2021; Luo et al., 2022). Cold stimulated T3 increase can promote facultative thermogenesis by regulating aerobic metabolism and energy release (Tsibulnikov et al., 2020). Skeletal muscle is the primary facultative thermogenic organ enabling birds to cope with cold challenge (Rowland et al., 2015). The above skeletal muscle metabolome variation indicates that high-temperature incubation can reduce the facultative thermogenesis capacity of birds responding to cold.
The variation observed in serum T3 level, metabolic rate, and tissue metabolomes suggest that incubation temperature can lead to developmental plasticity in an individual’s thermogenic capacity to cope with cold. Higher incubation temperature may reduce the cold tolerance capacity of Japanese Quails. The survival rate of small passerine birds in winter is largely dependent on their capacity to produce heat (Zheng et al., 2008; Cortés et al., 2015; Petit et al., 2017). In the context of global climate change, heat waves or cold waves frequently occur in the mid-to high-latitudes of the Northern Hemisphere (Rahmstorf and Coumou, 2011; Stillman, 2019). Due to the unpredictability of the climate, the environmental conditions birds encounter at different life history stages can vary. A reduction in thermoregulatory capacity caused by high temperatures during the incubation period may result in individuals who are unable to cope with cold winter. For example, some populations of wild Japanese Quails breed in Northeast Asia and migrate to warm areas such as the southeastern coast of China to overwinter (Song et al., 2008). The super El Nino event in the winter of 2016 resulted in an average temperature decrease of more than 6 ℃ in eastern and southern Asia (Qian et al., 2018; Sun et al., 2018; Ma and Zhu, 2019). A cold wave in central and eastern China in 2018 caused a cooling range of 12 ℃–14 ℃ in many areas. However, during the bird breeding season in May to July of the same year, many areas in the mid-latitudes of the Northern Hemisphere were severely affected by heatwaves (Vogel et al., 2019). Therefore, high temperatures during the breeding season may result in the development of a low thermogenic phenotype. Climate instability may result in a mismatch between the thermoregulatory phenotype and cold environment in postnatal stage.
Variation in incubation temperature can result in developmental plasticity of physiological phenotype in response to cold in Japanese Quails. Individuals that were incubated at higher temperature demonstrated lower serum T3 levels, resting metabolic rate, lower rates of oxidative catabolism in the liver and lower activity of lipid oxidative catabolism in the skeletal muscle when exposed to cold environments. These findings suggest that climate warming may affect the embryonic development of birds, and may lead to a mismatch between the physiological phenotypes and cold environments in postnatal stage.
Permission to handle our study animals was given by Animal Research Ethics Committee of Minzu University of China (permit no. 20200121 A A). Experimental procedures comply with the ARRIVE guidelines and were carried out in accordance with the National Institutes of Health guide for the care and use of laboratory animals (NIH Publications No. 8023, revised 1978).
Yingxin Kou: Writing – original draft, Methodology, Investigation. Rongmiao Zhang: Methodology. Xiaoqian Li: Investigation. Na Zhu: Investigation. Yihang Huang: Investigation. Shuping Zhang: Writing – review & editing, Supervision, Project administration, Funding acquisition, Conceptualization.
The authors declare that they have no known competing financial interests or personal relationships that could have appeared to influence the work reported in this paper.
Supplementary data to this article can be found online at https://doi.org/10.1016/j.avrs.2024.100193.
Figures(8) / Tables(1)


| Response variable | Explanatory variable | F | P |
| Serum T3 | Incubation temperature | 49.467 | <0.010 |
| Body mass | 0.061 | 0.807 | |
| Sex | 0.143 | 0.708 | |
| Incubation temperature×body mass | 0.149 | 0.862 | |
| Incubation temperature×sex | 0.088 | 0.916 | |
| Metabolic rate | Incubation temperature | 4.465 | <0.050 |
| Body mass | 0.134 | 0.718 | |
| Sex | 0.946 | 0.343 | |
| Incubation temperature×body mass | 0.412 | 0.669 | |
| Incubation temperature×sex | 2.189 | 0.147 |
DownLoad:
CSV
 Email Alerts
 RSS Feeds