Key Laboratory of Bio-resources and Eco-environment of Ministry of Education, College of Life Sciences, Sichuan University, Chengdu,
610065, China. E-mail address: wuyongjie@scu.edu.cn (Y. Wu)
The life-history strategies of organisms are shaped by trade-offs among traits that influence survival, development, reproduction, and ultimately fitness. However, the specific physiological and environmental mechanisms driving population-level variation in phenotypic traits, particularly in relation to migratory adaptations, remain poorly understood. Elevational migration represents an adaptive behavior for mountain birds that offers a unique model to investigate adaptive phenotypes because of the diverse migratory strategies that have been observed within and between species. Flight muscles, as multifunctional organs, exhibit phenotypic variation that aligns with locomotor and thermoregulatory demands. Linking flight muscle phenotypes to migratory strategies can provide insights into inter- and intraspecific variation in migratory adaptations. In this study, we examined spring arrival dates at high-altitude breeding sites for three closely related high-altitude breeding birds in the mountains of Asia: Blue-fronted Redstart (Phoenicurus frontalis), Himalayan Bluetail (Tarsiger rufilatus), and Rufous-gorgeted Flycatcher (Ficedula strophiata). We analyzed relationships between arrival dates and phenotypic traits, including flight muscle physiology, morphology, and internal organ mass, alongside environmental effects on these traits. Our findings indicate that species arriving earlier encountered lower temperatures and exhibited reduced fiber cross-sectional areas coupled with higher fast oxidative glycolytic (FOG) fibers densities. Males displayed pronounced protandry and higher fast glycolytic (FG) fibers densities. Ambient temperature significantly influenced flight muscle phenotypes, highlighting intraspecific variation and the potential plasticity of flight muscle fibers as crucial mechanisms for adapting to migration strategies and environmental conditions. Additionally, this study underscores the potential role of sexual selection in shaping functional phenotypic variation, further advancing our understanding of adaptive strategies in high-altitude migratory birds.
The phenotype of an organism is the sum of structural and functional properties, which can be observed and measured, including morphological structures, physiological characteristics, life history traits, and other traits that are widely studied in biology (Yvon-Durocher and Allen, 2012; Tellería et al., 2013). Functional phenotypes are shaped by both genetic and environmental factors, allowing organisms to adapt to environmental challenges by optimizing performance and survival (Ricklefs and Wikelski, 2002; West-Eberhard, 2003). Understanding the associations between phenotypes and environmental pressures is a prerequisite for uncovering the mechanisms of adaptation at the individual and population level.
Elevational migration, which is common in montane birds, involves relatively short-distance, elevation shifts between breeding and non-breeding sites (Williamson and Witt, 2021). Elevational migrants typically ascend to higher elevations to breed and descend to lower elevations during the non-breeding season (Boyle, 2017). Unlike long-distance latitudinal migration, elevational migration occurs over shorter geographic distances but often results in dramatic environmental changes (Körner, 2007), requiring birds to adapt to substantial shifts in climate, resource availability, and predation pressure. Among the various environmental factors influencing elevational migration, temperature emerges as a key driver. Variations in temperature along elevational gradients dictate the timing of migration and directly impact birds' physiological and behavioral responses (Storz et al., 2010). Many elevational migrants track favorable temperature ranges to optimize metabolic performance and avoid thermal stress, particularly during energetically demanding activities such as breeding (DuBay and Witt, 2014; Boyle, 2017). In addition, temperature gradients indirectly shape resource availability, as seasonal changes in fruiting plants or insect abundance often correlate with elevation (Boyle, 2010). These environmental pressures demand specific phenotypic adjustments, such as changes in flight muscle structure and function, to enable elevational migrants to navigate the energetic and mechanical challenges associated with seasonal movements (Chang et al., 2024; Rhodes et al., 2024). As such, elevational migration provides an excellent system to study how phenotypic traits mediate adaptation to complex environmental gradients, offering insights into population dynamics and species' adaptive capacity.
The avian pectoralis, which can account for up to 25% of the avian body mass (Marden, 1987), is a multifunctional organ, impacting flight and thermogenesis, and thus playing a vital role in migration and other essential ecological activities (e.g., courtship displays, predator avoidance, and foraging behavior) (Schultz et al., 2001; Rowland et al., 2015; Lalla et al., 2020). The pectoralis muscle mass can undergo fluctuations before, during, and after migration, including hypertrophy prior to migration to meet the energy demands of flight (Vernasco et al., 2021; Sharma et al., 2022), and subsequent mass loss after migration due to energy depletion (Swanson, 2010). However, research into the underlying structural variation in the pectoralis muscle among species with different behavioral and environmental demands remains incomplete. Examining the pectoralis muscle as it relates to different migration strategies can offer insights into the associates between form and function. For example, a critical feature of skeletal muscle microstructure is fiber composition, which impacts muscle capacity for different tasks, such as sustained low-intensity activities (e.g., maintaining a position) or high-intensity activities (e.g., sustained flapping) (Schiaffino and Reggiani, 2011). Vertebrate skeletal muscle typically contains three fiber types: slow oxidative (SO), fast glycolytic (FG), and fast oxidative glycolytic (FOG) fibers (Welch and Altshuler, 2009). SO fibers have slow contraction velocities and high fatigue resistance, supporting activities like maintaining posture (Meyers and Stakebake, 2005). FG fibers are characterized by rapid contraction and quick fatigue, and are suited for high-power activities, like take-off and burst flight (Rosser and George, 1985, 1986). FOG fibers have intermediate functional properties to SO and FG fibers, offering faster contraction with some fatigue resistance, and are important for sustaining shivering thermogenesis in birds (Rosser and George, 1986; Rowland et al., 2015; Chaillou, 2018).
In small-bodied birds (body mass < 20 g), the pectoralis muscles are predominately composed of two fiber types: FOG and FG. The amount of each fiber type in the pectoralis is shaped by ecology and life history of the species, and are expected to vary in response to a suite of functional demands on the organism, which may change seasonally and across the lifetime of an individual (Velten et al., 2016; DuBay et al., 2020). Migratory birds that breed at high elevations endure prolonged aerobic exercise during migration and face dual environmental challenges at their breeding sites: low oxygen and cold temperatures. To cope with these environmental conditions, these species increase oxidative capacity with higher proportions of FOG fibers compared to lowland residents (e.g., Scott et al., 2009). On the other hand, FG fibers are suited for different functional demands, like those stemming from behavioral and life history differences between sexes. Territorial males, for instance, may benefit from FG fibers to enhance explosive flight during competitive interactions (DuBay et al., 2020). Despite important insights regarding flight muscle fiber variation and function, adaptation of flight muscle phenotypes in birds in response to the functional demands of migration and reproduction remains incomplete.
In this study, we investigated inter- and intraspecific variation in flight muscle phenotypes in three high-elevation breeding species of Muscicapid flycatchers (family Muscicapidae): Blue-fronted Redstart (Phoenicurus frontailis), Himalayan Bluetail (Tarsiger rufilatus), and Rufous-gorgeted Flycatcher (Ficedula strophiata). Each species exhibits sexual dichromatism in plumage and seasonal territoriality (Tobias et al., 2016). These species undergo elevational migration in the Himalayas and Hengduan ranges in Asia, ascending to higher elevations during the breeding season (Williamson and Witt, 2021; Haase et al., 2023). Based on field records and literature, the three species are thought to enter the breeding season at approximately the same time (Collar, 2020; Clement, 2020; del Hoyo et al., 2023). P. frontailis and T. rufilatus share a similar elevational distribution, migrating short latitudinal distances within the region and breeding above 3000 m. In contrast, F. strophiata engages in longer-distance migration with elevation changes, moving further south to overwinter, while breeding at elevations above 2000 m at our study site in the Hengduan Mountains (Cheng et al., 2022; He et al., 2022). Consequently, these closely-related species encounter varying environmental stresses during migration and throughout the year, making them suitable candidates for studying elevational migration and associated inter- and intraspecific variation in flight muscle phenotypes.
We hypothesize that: (1) species-specific life-history strategies, such as arriving earlier at high-elevation breeding sites (thus experiencing colder temperatures) or undertaking longer-distance elevational migrations, will exhibit larger pectoralis muscles and FOG fiber phenotypes that support increases in oxidative capacity; (2) Intraspecific variation in flight muscle phenotypes will be related to sexual selection and protandry (i.e., male birds arriving to breeding grounds before female birds to secure breeding territories). Males will exhibit larger pectoralis muscles and prioritize variation in FG fibers due to the high-intensity activity involved in courtship displays and territorial behavior early in the reproductive process. This study will provide insight into how species reconcile competing functional demands on essential ecological traits.
2.
Materials and methods
2.1
Study site, sampling, and temperature data
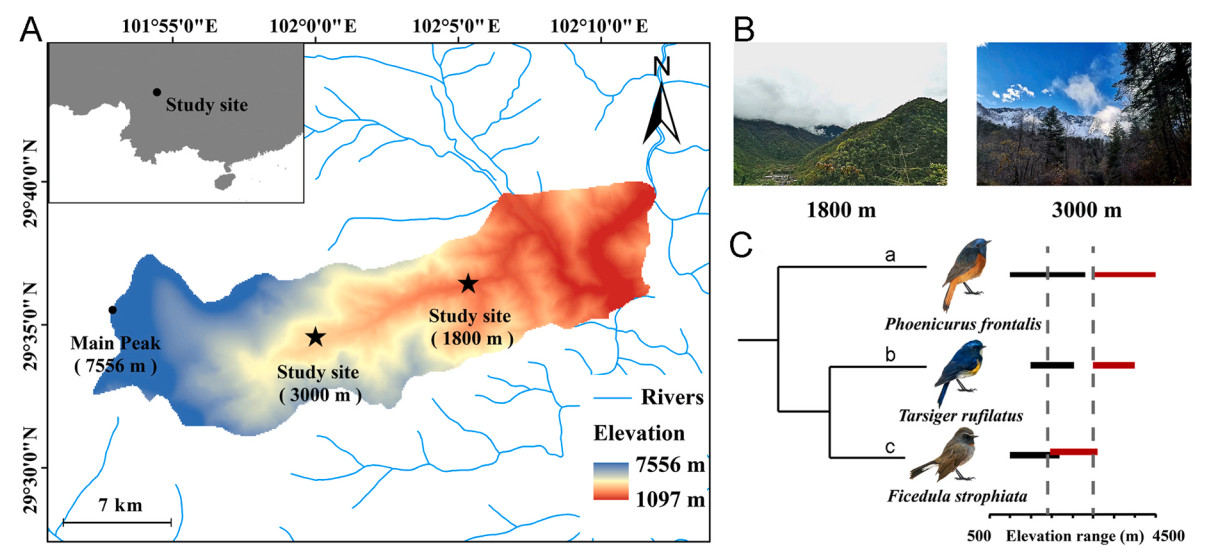
We studied above-mentioned three bird species within the family Muscicapidae that breed in the mountains of Central Asia that exhibit variation in breeding and non-breeding elevational distributions (Fig. 1C). We sampled birds in the Hailuogou Valley, Sichuan, China (29.576096° N, 101.998624° E), on the eastern edge of the Qinghai-Tibet Plateau, during annual migration to breeding elevations (Fig. 1A) in spring 2021 (i.e., March 10th to June 10th). We sampled two elevational bands (1800 m and 3000 m) simultaneously with 11–13 12-m mist nets at each elevation. These sampling sites included non-breeding and breeding elevations (Fig. 1B). Surveys were conducted daily throughout the study period, with mist nets deployed from sunrise (±1 h) to sunset (±1 h) on each survey day. We also recorded temperature and humidity using data loggers (Kongsaien, COS-04) at each sampling elevation to measure the maximum and minimum temperatures on the day each bird was captured.
Figure
1.
(A) Study area, generated using ArcGIS 10.5. Source of the administrative map from the National Geomatics Center of China (http://www.webmap.cn) (GS (2023)2767). (B) Sample plot habitats. (C) Evolutionary relationships and life histories of three study species in the family Muscicapidae. An analysis of evolutionary relationships among species based on phylogenetic reconstruction using the posterior set of pruned trees from Jetz et al. (2012). Elevational distributions are from the Handbook of the Birds of the World Alive (www.birdsoftheworld.org) and six years of field survey in this region (He et al., 2022). Sampling elevations are indicated by dotted vertical lines. Red horizontal lines represent species breeding elevational distribution, while black horizontal lines represent species winter distribution. Species codes (from top): a, Blue-fronted Redstart (Phoenicurus frontalis); b, Himalayan Bluetail (Tarsiger rufilatus); c, Rufous-gorgeted Flycatcher (Ficedula strophiata).
We measured morphological traits (measurements are detailed in Appendix Table S1). All individuals were then euthanized through cervical dislocation, and we then measured metabolic organ masses (heart mass, liver mass, lung mass). The entirety of the right pectoralis was dissected out and weighed. Its mass was then used for subsequent calculations regarding relative fiber masses. All sampled birds were adults, determined by plumage assessment.
2.3
Pectoralis histology
We unilaterally excised the pectoralis muscle, transversely sectioning the middle third of each muscle, which we then mounted on cork, embedded in O.C.T., and immersed in supercooled isopentane solution (supercooled with liquid nitrogen) to flash freeze samples. Samples were subsequently wrapped in aluminum foil, stored in liquid nitrogen, and transported back to the laboratory. In the lab, muscles were sectioned (10 μm) using a −20 ℃ cryostat (Microtome, Leica CM 1950, Germany). Each section represented an entire transverse cross-section within the middle third of the pectoralis. We then stained muscle sections with succinate dehydrogenase to identify oxidative and glycolytic muscle fibers. Additionally, to confirm the presence of only two fiber types in the flight muscles of the three bird species, we stained other muscle sections with myosin adenosine triphosphatase (mATPase). Furthermore, other muscle sections were stained with alkaline phosphatase (ALP/AKP) to identify capillaries. Histology slides were imaged using a Digital panoramic scanner (Wisleap WS-10) and analyzed in Image J. Given that fiber type can vary across muscle depth (Scott et al., 2009), we randomly selected different areas across the cross-section to image and analyze. This methodology allows us to obtain whole-muscle fiber averages. Fiber mass and average fiber cross-sectional area (CSA) were then calculated for the different fiber types following previously described methods (Egginton, 1990; Deveci et al., 2001; DuBay et al., 2020). Capillary density was calculated following the method described by Deveci et al. (2001) (refer to Appendix A for detailed equations). To account for any heterogeneity within a cross-section, we evaluated a sufficient number of images (> 8) to achieve a stable mean value.
2.4
Data analyses
To assess arrival date of the three species to their breeding sites, we analyzed data collected from the 3000 m sampling plot (breeding elevation). To assess overall trends in phenotypic trait variation, we tested for statistical differences between species and between sexes using analysis of variance tests for all data. We analyzed flight muscle fiber data (i.e., fiber cross-sectional area, FG fiber mass, FOG fiber mass) as raw values and relative values (calculated as mass of the given trait divided by body mass to get mass-specific values). We also calculated the fiber density and the ratio of FOG mass to FG mass (FOG/FG) to assess the relative amounts of each fiber type within the pectoralis. Comparisons were performed using Tukey's post-hoc tests for each trait. Differences were treated as significant if P < 0.05, and effect sizes were calculated from analysis of variance (ANOVA) as partial eta squared (η2) (refer to Appendix A for detailed equations).
To investigate the main biotic and abiotic factors associated with muscle fiber composition, we applied general linear mixed models (GLMMs) using data collected from 1800 m to 3000 m sampling elevations. The key predictors included: (i) sex; (ii) the elevation where the bird was caught; (iii) the date of capture; and (iv) the upper elevation limit for the species during the breeding season (UBEL, based on six years of previous surveys; He et al., 2022). The model structure was: Fiber phenotype ~ Elevation + Sex + Date + UBEL + Elevation × Sex + Elevation × Date + Sex × Date + Elevation × Date × Sex + (1|Species). GLMMs were fitted with a Gaussian error distribution, as the response variables satisfied the assumptions of normality and homoscedasticity. The glmm.hp function from the "glmm.hp" package was used to assess the relative contributions of species-specific factors and abiotic environmental factors (Lai et al., 2022).
Based on the significant effects of elevation and date identified by the GLMMs, we conducted multiple regression analyses to further explore how specific environmental variables influence muscle fiber traits at high altitudes. The environmental predictors included: (i) the diurnal temperature difference on the day each individual was captured; (ii) the mean daily temperature on the day each individual was captured; (iii) the mean monthly temperature in the month each individual was captured; (iv) atmospheric oxygen content where the bird was captured (download from the atmospheric pressure database of Shi, 2022); (v) mean solar radiation; and (vi) mean annual wind speed (descriptions are detailed in Appendix Table S2). These predictors were chosen for their relevance to high-altitude environments and their potential physiological impacts on muscle fiber traits. Prior to modelling, variables with correlations between variables of 0.7 or more and variance inflation factors greater than 10 were excluded (Zuur et al., 2010; Dormann et al., 2013). The best-fitting models were selected based on a modified Akaike Information Criterion Correction (AICc). Model weights were calculated to assess the relative importance of explanatory variables (Anderson and Burnham, 2002; Johnson and Omland, 2004). Prediction intervals were computed using the ggeffectsggpredict function in R to evaluate the results from the mixed linear models and multiple regression models.
3.
Results
3.1
Interspecific variation in pectoral muscle phenotypes in relation to arrival date
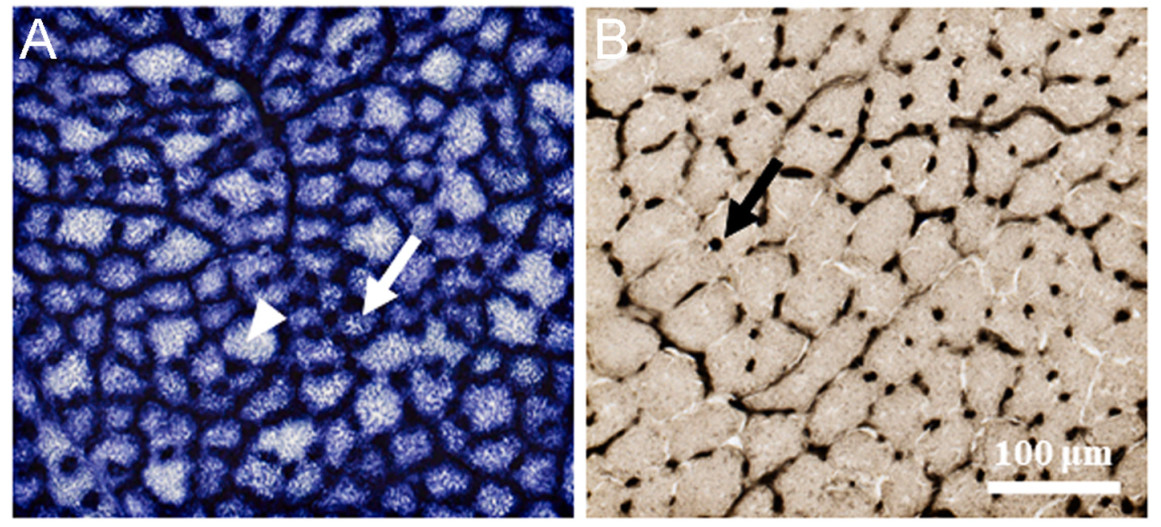
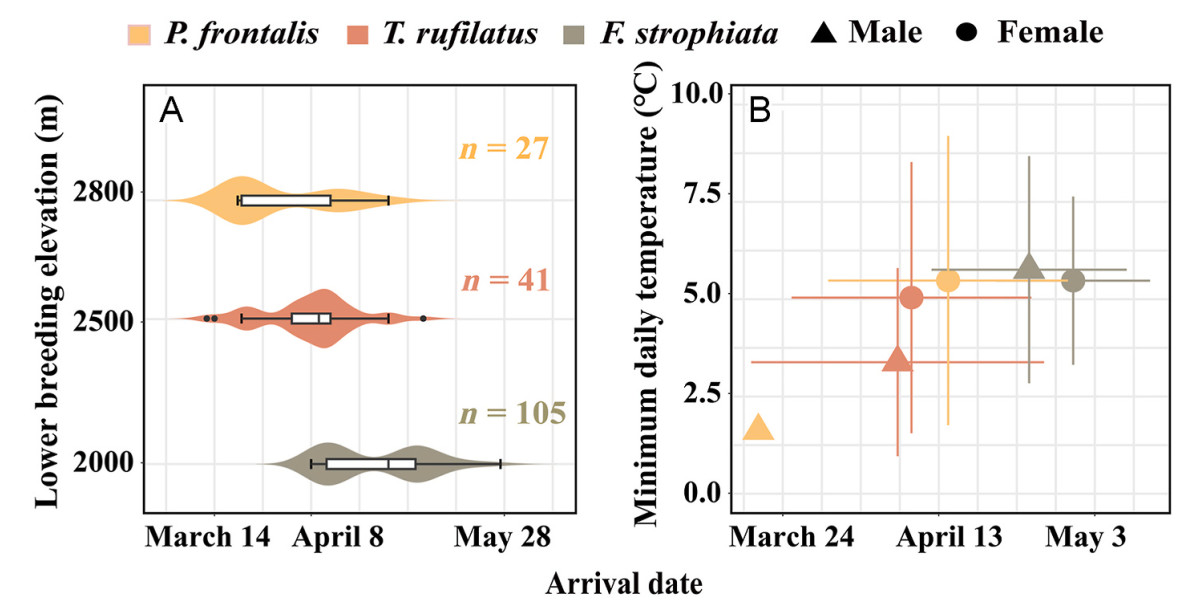
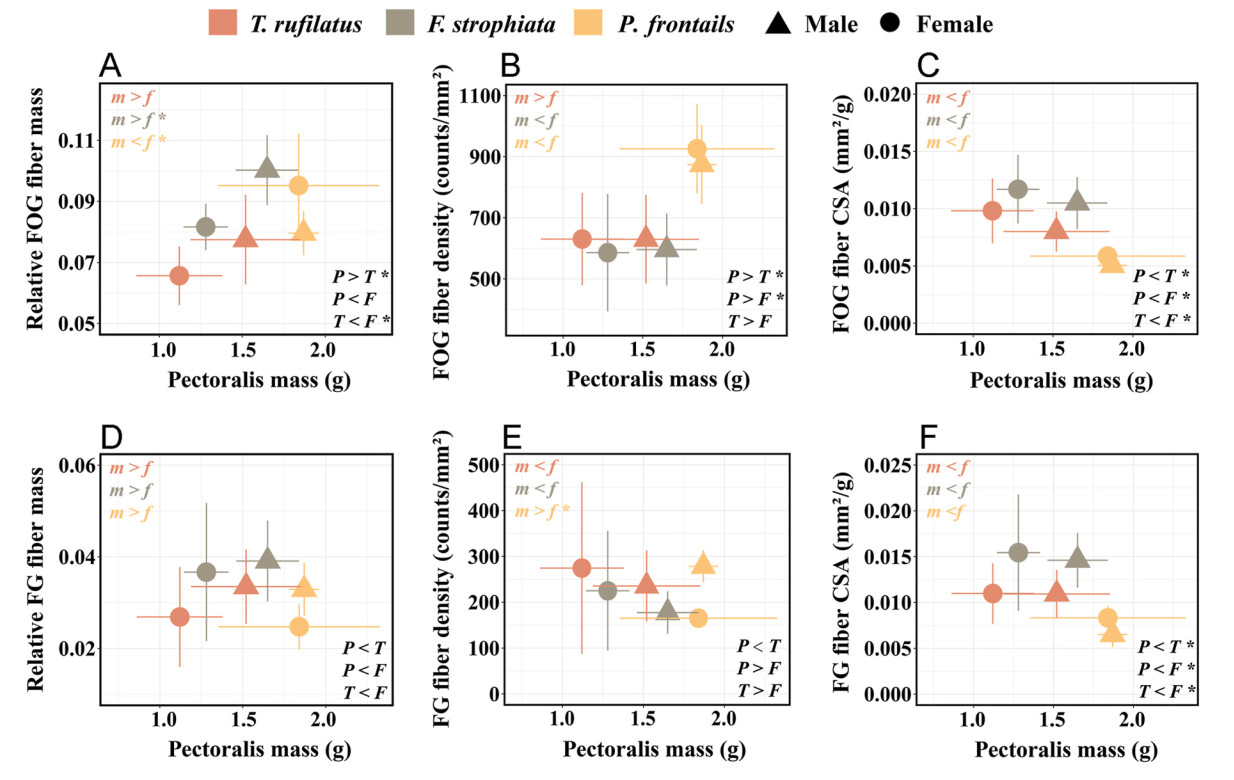
We observed two muscle fiber types, fast glycolytic fibers (FG) and fast oxidative glycolytic fibers (FOG), in the pectoral muscles of all three species (Fig. 2A; Appendix Fig. S1). Among the three species, the heavier birds showed a tendency to arrive earlier at the breeding site (Table 1; Appendix Figs. S2, S3). P. frontalis, as the largest species, had the earliest arrival to high-elevation breeding sites, and P. frontalis faced the coldest periods in early spring, followed by T. rufilatus and F. strophiata (Fig. 3; Appendix Fig. S4; Table 1, Table 2). P. frontalis exhibited higher FOG fiber density, smaller fiber CSA, and lower capillary density (Fig. 4; Table 1). Additionally, the last-arriving species, F. strophiata, had the smallest body mass and exhibited the greatest relative pectoralis mass and relative FOG fiber mass, but exhibited greater muscle fiber CSA and lower FOG fiber density (Fig. 4; Table 1; Appendix Figs. S5–6). We found no significant differences among species in relative FG fiber mass, FG fiber density, and FOG/FG fiber ratio (Table 1).
Figure
2.
Histochemical staining of pectoralis muscle and capillaries. FOG fibers (white arrow) and FG fibers (white arrowheads) are present. (A) Succinate dehydrogenase (SDH), a mitochondrial enzyme that depicts oxidative capacity. (B) Alkaline phosphatase to identify capillaries (black arrow).
Table
1.
Species differences in morphological traits, flight muscle fiber phenotypes, experienced temperature, and arrival time.
Trait
F. strophiata
P. frontalis
T. rufilatus
P
η2
Body mass (g)
11.47±0.75A
15.91±1.59B
13.039±1.29C
< 0.001
0.70
N
37
13
17
Body length (mm)
124.61±6.91A
142.46±6.96B
136.588±4.08C
< 0.001
0.59
N
36
13
17
Pectoralis mass (%, relative)
0.13±0.02A
0.11±0.02B
0.11±0.02B
< 0.001
0.31
N
37
13
17
FG fiber mass (%, relative)
0.038±0.01A
0.030±0.01A
0.031±0.01A
0.019
0.03
N
31
12
16
FG FCSA (mm2)
0.0017±0.0004A
0.0011±0.0002B
0.0014±0.0003A
< 0.001
0.31
N
31
12
14
FG FCSA (%, per mass)
0.0148±0.0041A
0.0071±0.0015B
0.0109±0.0027C
< 0.001
0.53
N
31
12
14
FG fiber density (counts/mm2)
191.25±80.80A
240.74±62.67A
246.69±112.26A
0.05
0.08
N
31
12
16
FOG fiber mass (%, relative)
0.095±0.01A
0.085±0.01A
0.075±0.01B
< 0.001
0.30
N
31
12
16
FOG FCSA (mm2)
0.0013±0.0003A
0.0009±0.0001B
0.0011±0.0002A
< 0.001
0.41
N
31
12
14
FOG FCSA (%, per mass)
0.0108±0.0025A
0.0053±0.0007B
0.0085±0.0021C
< 0.001
0.57
N
31
12
14
FOG fiber density (counts/mm2)
592.89±139.89A
891.46±130.97B
629.85±140.50A
< 0.001
0.43
N
31
12
16
FOG/FG
2.71±0.98A
2.95±0.85A
2.49±0.70A
0.39
0.01
N
31
12
14
Capillary density (counts/mm2)
3.37±1.33A
1.73±0.76B
4.607±1.68C
< 0.001
0.31
N
33
9
14
Maximum daily temperature (℃)
13.74±5.10A
7.13±3.80B
11.26±5.13C
< 0.001
0.43
N
105
27
41
Minimum daily temperature (℃)
6.08±2.72A
2.24±2.07B
4.04±3.05C
< 0.001
0.33
N
105
27
41
Arrival date
April 27th±13A
March 31st±13B
April 7th±12C
< 0.001
0.32
N
105
27
41
The mean values, standard deviation, and sample sizes for each trait are reported for each species. Superscript letters denote pairwise statistical differences for a given trait based on post hoc tests following one-way ANOVA, where species with different letters are significantly different at P < 0.05, while species with similar letters are not statistically different from one another for that trait. The effect size of “species” is reported as partial eta squared (η2) for each trait. “FCSA” = fiber cross-sectional area; “relative” = mass of the trait analyzed as a proportion of body mass or body length.
Figure
3.
Intraspecific and interspecific arrival date at the breeding site. (A) The box plots show median date and quartiles of arrival data for three the three species. Violin plots show the distributions of arrival date. (B) Species means of minimum daily temperature on the day of capture for each individual plotted by sex class (with standard error bars).
Table
2.
Sex differences in morphological traits, flight muscle fiber phenotypes, experienced temperature, and arrival time.
Trait
F. strophiata female
F. strophiata male
P
η2
P. frontalis female
P. frontalis male
P
η2
T. rufilatus female
T. rufilatus male
P
η2
Body mass (g)
10.86±0.64
11.80±0.59
0.001
0.38
14.71±1.93
16.64±0.73
0.06
0.37
12.42±1.18
13.37±1.26
0.03
0.27
N
13
24
5
8
6
11
Body length (mm)
121.23±5.15
126.52±7.14
0.02
0.13
143.20±5.58
142.00±8.03
0.23
0.01
135.16±3.31
137.36±4.38
0.30
0.07
N
13
23
5
8
6
11
Wing length (%, relative)
7.56±0.75
8.32±0.73
0.01
0.18
8.65±0.53
8.74±0.48
0.79
0.01
7.93±0.92
8.63±0.98
0.24
0.11
N
13
23
5
8
6
11
Pectoralis mass (%, relative)
0.12±0.01
0.14±0.02
< 0.001
0.33
0.11±0.03
0.11±0.01
0.81
0.01
0.10±0.02
0.11±0.02
0.13
0.15
N
13
24
5
8
6
11
FG mass (%, relative)
0.037±0.02
0.039±0.01
0.89
0.03
0.025±0.00
0.033±0.01
0.06
0.24
0.027±0.01
0.033±0.01
0.10
0.11
N
9
22
4
8
6
10
FOG mass (%, relative)
0.082±0.01
0.100±0.01
< 0.001
0.40
0.095±0.02
0.080±0.01
0.04
0.34
0.071±0.01
0.077±0.01
0.36
0.05
N
9
22
4
8
6
10
FG FCSA (%, per mass)
0.0154±0.0063
0.0146±0.0029
0.96
0.03
0.0083±0.0013
0.0064±0.0013
0.08
0.18
0.0109±0.0033
0.0109±0.0026
0.88
0.08
N
9
22
4
8
4
10
FOG FCSA (%, per mass)
0.0117±0.0029
0.0104±0.0022
0.31
0.01
0.0058±0.0008
0.0050±0.0004
0.12
0.13
0.0098±0.0028
0.0080±0.0017
0.25
0.02
N
9
22
4
8
6
10
FOG fiber density (counts/mm2)
585.73±191.97
595.81±117.84
0.69
0.02
925.92±146.14
874.22±129.56
0.55
0.06
630.40±151.04
629.62±144.60
0.8
0.08
N
9
22
4
8
6
10
FG fiber density (counts/mm2)
224.96±130.73
177.46±46.17
0.71
0.02
165.12±10.23
278.54±35.02
0.006
0.64
274.69±187.40
235.49±77.52
0.88
0.08
N
9
22
4
8
6
10
FOG/FG
2.69±1.30
2.72±0.85
0.79
0.03
3.88±0.54
2.49±0.54
0.01
0.11
2.69±0.84
2.40±0.66
0.57
0.06
N
9
22
4
8
6
10
Capillary density (counts/mm2)
3.50±1.21
3.28±1.41
0.72
0.02
1.82±1.06
1.65±0.53
0.75
0.01
5.02±2.48
4.29±0.74
0.45
0.01
N
12
21
4
5
6
8
Maximum daily temperature (℃)
11.01±4.37
14.67±5.00
0.001
0.10
8.44±4.43
6.60±3.40
0.001
0.11
13.80±5.08
9.87±4.63
0.001
0.16
N
21
84
10
17
14
27
Minimum daily temperature (℃)
5.17±1.98
6.39±2.87
0.001
0.03
3.09±2.92
1.89±1.48
0.01
0.02
4.78±3.54
3.64±2.69
0.62
0.00
N
21
84
10
17
14
27
Arrival date
May 1st±10
April 23rd±13
0.01
0.04
April 7th±14
March 27th±11
0.04
0.12
April 8th±11
April 7th±13
0.49
0.01
N
21
84
10
17
14
27
The mean values, standard deviation, and sample sizes for each trait are reported by sex for each species. p-values from one-way ANOVA are bolded when P < 0.05. Partial eta squared effect sizes (η2) are reported by species for each trait. “FCSA” = fiber cross-sectional area; “relative” = mass of the trait analyzed as a proportion of body mass or body length.
Figure
4.
Relationships between pectoralis mass and fiber phenotypes in different species and sexes. (A) Relationship between pectoralis mass and relative fast oxidative glycolytic (FOG) fiber mass. (B) Relationship between pectoralis mass and FOG fiber density. (C) Relationship between pectoralis mass and FOG fiber cross-sectional area (CSA) expressed relative to body mass. (D) Relationship between pectoralis mass and relative fast glycolytic (FG) fiber mass. (E) Relationship between pectoralis mass and FG fiber density. (F) Relationship between pectoralis mass and FG fiber CSA expressed relative to body mass. Species means with standard error bars are shown by sex. Statistical significance: Top left corner: Sex differences within species (m = male, f = female; denoted in species-specific colors). Bottom right corner: Species differences (P = P. frontalis, T = T. rufilatus, F = F. strophiata). Significant differences marked with ∗, P < 0.05. Sample sizes for each trait are detailed in Table 1, Table 2
3.2
Intraspecific variation in pectoral muscle phenotypes in relation to arrival date
Males of P. frontalis and F. strophiata consistently arrived at high-altitude breeding sites earlier than females; however, the phenotypic differences associated with sex were not uniformly expressed across populations (Fig. 3; Table 2). In P. frontalis, male protandry was particularly pronounced, with males arriving an average of 11 days earlier than females and encountering cooler temperatures. These males exhibited significantly higher FG fiber densities, lower relative FOG masses, and reduced FOG/FG ratios compared to females (Table 2). In F. strophiata, males arrived approximately eight days earlier than females and demonstrated greater body size, higher relative pectoralis muscle mass, and increased relative FOG fiber mass, although they did not encounter colder temperatures. In contrast, no significant intersexual differences in arrival timing or muscle phenotypes were observed in T. rufilatus (Fig. 4; Table 2).
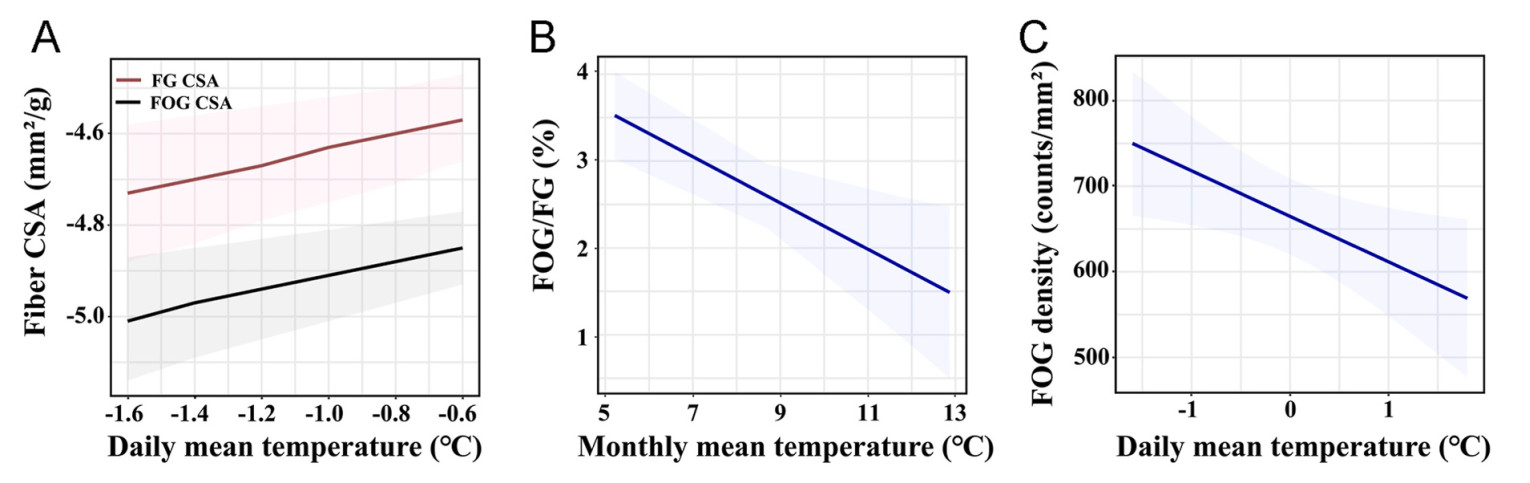
We utilized linear regression models to examine the relationships between climatic environmental conditions and pectoral muscle phenotypic traits. An analysis of the relative contributions of sex and environmental factors to variations in flight muscle fiber phenotypes demonstrated that environmental factors provided greater explanatory power for variations in relative pectoral muscle mass and cross-sectional area (CSA) (Appendix Fig. S7C–F). General mixed linear model results indicated that flight muscle fiber phenotype variations were correlated with altitude and date (Fig. 5; Appendix Fig. S2, Tables S3–S4). Model weights suggested that among environmental factors, temperature and atmospheric oxygen content were likely the primary variables associated with muscle fiber phenotype changes (Appendix Table S4). Specifically, temperature was positively correlated with relative pectoral muscle mass and CSA, but negatively correlated with FOG fiber density and the FOG/FG ratio (Fig. 5; Appendix Table S4). Conversely, atmospheric oxygen content was negatively correlated with relative fiber mass and CSA, while positively correlated with FOG fiber density (Appendix Table S4).
Figure
5.
Effects of environmental factors on muscle fiber phenotypes. The predicted relationships between muscle fiber phenotypes and environmental factors based on multivariate linear model selection. (A) Relationship between daily mean temperature (℃) and cross-sectional area (CSA, mm2/g) of fast glycolytic (FG) and fast oxidative glycolytic (FOG) fibers. (B) Relationship between monthly mean temperature (℃) and the ratio of FOG to FG fibers (%). (C) Relationship between daily mean temperature (℃) and FOG fiber density (counts/mm³). Predicted values, including 95% confidence intervals (shaded areas), are conditioned on all explanatory variables. Results of the analyses are presented in Appendix Table S4.
By integrating morphological, physiological, and behavioral data across species and sexes, and combining these with environmental data, we examined how different inter- and intraspecific life-history strategies are linked to flight muscle phenotypes. These phenotypes balance the varying functional demands faced by elevational migrants during the pre-breeding period.
As hypothesized, the earlier-arriving P. frontalis exhibited high FOG fiber mass and FOG fiber density, which should increase muscle oxidative capacity, facilitating earlier arrival to high-elevation breeding sites when temperatures are low. However, F. strophiata showed similar levels and dependence on FOG fibers despite later arrival. This finding could be explained by the dual functionality of FOG fibers, which benefit thermogenesis as well as sustained flight. Increased FOG fibers and relative pectoralis muscle mass in F. strophiata would support the longer-distance migratory requirements of the species, as has been observed in other high-altitude migratory and resident birds (Scott et al., 2009; Xiong et al., 2022). Additionally, interspecific variation in FOG fiber cross-sectional area (FCSA) may be related to the arrival time in early spring (Appendix Fig. S3). Smaller fiber cross-sectional area is known to increase muscle fiber oxidative capacity by increasing the efficiency of oxygen transport and delivery from capillaries into and through the cell (van Wessel et al., 2010). P. frontalis, which arrives to breeding elevations the earliest, exhibits the smallest FOG fiber cross-sectional area, which should enhance oxidative capacity and sustained shivering thermogenesis when birds first arrive to breeding elevations in early spring. In contrast, F. strophiata, which avoids the coldest temperatures by arriving later and breeding at slightly lower elevations, exhibits the larger FOG fiber cross-sectional area. While this feature is expected to decease muscle oxidative capacity, and negatively impact fatigue resistance for longer migratory flight, F. strophiata appears to offset this reduction in oxidative capacity by increasing relative pectoralis mass and relative FOG fiber mass. This delayed arrival at breeding grounds may not only reflect an avoidance of colder conditions but could also result from the longer migratory distances required to travel from remote wintering areas. T. rufilatus exhibited intermediate FOG fiber phenotypes compared to the other two species, which is consistent with its intermediate arrival time and less need for muscle phenotypes that facilitate early-spring cold tolerance or long-distance migration. Our results highlight the different ways that flight muscle phenotypes can be adjusted to meet species-specific functional demands, but it is important to recognize that muscle traits are highly plastic across the lifetime of organisms and between seasons. In this study, we capture data from a time slice in the life cycle of elevational migrants (i.e., spring migration), but future research will need to address if and how these traits change across the year to response to different seasonal functional contexts.
Our findings partially support the hypothesis that male-specific fiber adaptations may enhance the burst-flight activity required for male-male competitive interactions. Specifically, we observed that males exhibit significantly higher FG fiber densities compared to females, whereas females display a greater FOG/FG fiber ratio in the earliest arriving breeding population of P. frontalis. A similar pattern of male FG fiber phenotypic variation was observed in other alpine migratory bird populations, suggesting a potential role in facilitating male-male competition during the breeding season (DuBay et al., 2020). During this period, males engage in territorial defense and courtship displays to secure resources and mating opportunities (Dunn et al., 2004; Tobias et al., 2016; Mitoyen et al., 2019), which demand intense burst-flight activity (Scholes et al., 2017). Enhanced FG fiber capacity in the pectoral muscles is likely to improve the efficiency of these activities, ultimately increasing male fitness and reproductive success (DuBay et al., 2020). Conversely, the delayed arrival of females appears to serve as an energy-conserving strategy, allowing them to avoid unfavorable early spring conditions while shortening the interval between arrival and breeding. This enables females to allocate more resources to reproduction-related activities without heavily relying on pectoral muscle fiber adaptations (Doiron et al., 2015; Nicolau et al., 2021). Such sex-specific strategies are particularly evident in the earliest arriving P. frontalis, which occupy the highest-altitude breeding sites. In these resource-limited, high-elevation alpine environments, competition for high-quality territories and the advantage of early arrival are likely to be more pronounced, with males benefiting from securing favorable breeding territories through early arrival (Currie et al., 2000).
In contrast, T. rufilatus populations, where protandry was not as prominent, exhibited significant inter-sex differences in pectoral muscle fiber phenotypes. This supports the idea that individuals exposed to similar life-history strategies and environmental conditions may converge on analogous phenotypic traits. Notably, F. strophiata populations demonstrated significant protandry without corresponding FG fiber variation in males. Instead, males exhibited dominant phenotypes in relative pectoral muscle mass and FOG fiber mass, resembling adaptations to hypoxic conditions and long-distance migration (Table 2). These findings suggest that environmental selective pressures may outweigh sexual selection in shaping pectoral muscle phenotypic variation in some species, though this requires further investigation. Overall, our results highlight the complexity of pectoral muscle fiber phenotypes within populations, shaped by the interaction of sex, environmental conditions, and life-history strategies. This complexity likely reflects trade-offs between multiple selective pressures experienced by populations adapting to high-altitude environments. Future research should explore the genetic and epigenetic mechanisms underlying these phenotypic variations, as well as the interplay between behavioral ecology and physiological traits in shaping reproductive success across diverse alpine bird populations.
Our findings illustrate how species with diverse life-history strategies navigate competing functional demands during migration by modulating flight muscle fiber phenotypes. By linking these phenotypic adaptations to thermogenesis, migratory efficiency, and reproductive competition, we reveal the interplay between intrinsic factors (e.g., sexual selection, behavioral strategies) and extrinsic factors (e.g., environmental conditions) in shaping multifunctional organ traits. We acknowledge that imbalances in sex ratios within species may introduce potential biases in the statistical significance of some findings. Nevertheless, the within-population results and their potential implications for muscle fiber phenotypes remain biologically meaningful. These findings provide valuable insights into how sex-specific traits may influence the adaptation of flight muscles, particularly under the pressures of sexual selection and protandry. Our results also advance our understanding of how birds adapt to high-altitude environments and migratory challenges. Notably, the presence of FG fibers in these small-bodied birds (< 20 g) challenges the traditional assumption that their pectoralis muscles are predominantly composed of FOG fibers. This finding underscores the potential importance of burst-flight capacity even in small birds, which may be crucial for behaviors such as predator evasion, territorial defense, or courtship. In conclusion, this study underscores the plasticity of flight muscle phenotypes, shaped by trade-offs between ecological and evolutionary pressures. Future research should explore how these traits vary across life-history stages and respond to climate change. Additionally, investigating the genetic and epigenetic mechanisms underlying these phenotypic adaptations will deepen our understanding of the evolution of complex traits in high-altitude migratory bird populations.
All birds were caught with mist nets and handled following National Wildlife Conservation Law and with permission from the Forestry Department of Ganzi Tibetan Autonomous Prefecture. Tissue collection followed protocols approved by the animal experimental and medical ethics committee in the College of Life Science at Sichuan University (20201208001).
Declaration of competing interest
The authors declare the following financial interests/personal relationships which may be considered as potential competing interests: Yongjie Wu reports that financial support was provided by National Natural Science Foundation of China. Yongjie Wu reports that financial support was provided by Survey of Wildlife Resources in Key Areas of Tibet. If there are other authors, they declare that they have no known competing financial interests or personal relationships that could have appeared to influence the work reported in this paper.
Acknowledgments
We thank Renxiu Zhou, Yunhao Si, Xiaofeng Zheng, Kaize Feng, Kexin Peng and Yanni Zhang for their kind help with field data collection. We thank Faming Liu and Quan Lan at the Gongga Alpine Ecosystem Observation and Research Station for their kind assistance with the fieldwork. Thanks to the Gongga Mountain National Nature Reserve and Laojun Mountain National Nature Reserve for their help and support.
Anderson, D.R., Burnham, K.P., 2002. Avoiding pitfalls when using information-theoretic methods. J. Wildl. Manag. 66, 912–918.
Boyle, W.A., 2010. Does food abundance explain altitudinal migration in a tropical frugivorous bird? Can. J. Zool. 88, 204–213.
Boyle, W.A., 2017. Altitudinal bird migration in North America. Auk 134, 443–465.
Chaillou, T., 2018. Skeletal muscle fiber type in hypoxia: adaptation to high-altitude exposure and under conditions of pathological hypoxia. Front. Physiol. 9, 1450
Chang, R.M., Guglielmo, C.G., Ivy, C.M., 2024. Seasonal modulation of pectoralis muscle fiber type composition in migratory songbirds. J. Ornithol. 165, 889–895.
Cheng, Y.W., Wen, Z.X., He, X.C., Dong, Z.H., Zhangshang, M., Li, D., et al., 2022. Ecological traits affect the seasonal migration patterns of breeding birds along a subtropical altitudinal gradient. Avian Res. 13, 100066
Clement, P., 2020. Rufous-gorgeted flycatcher (Ficedula strophiata), version 1.0. In: del Hoyo, J., Elliott, A., Sargatal, J., Christie, D.A., de Juana, E. (Eds. ), Birds of the World. Cornell Lab of Ornithology, Ithaca, NY, USA.
Collar, N., 2020. Blue-fronted Redstart (Phoenicurus frontalis), version 1.0. In: del Hoyo, J., Elliott, A., Sargatal, J., Christie, D.A., de Juana, E. (Eds. ), Birds of the World. Cornell Lab of Ornithology, Ithaca, NY, USA.
Currie, D., Thompson, D.B.A., Burke, T., 2000. Patterns of Territory Settlement and Consequences for Breeding Success in the Wheatear Oenanthe Oenanthe. Ibis 142, pp. 389–398.
del Hoyo, J., Collar, N., Christie, D.A., 2023. Himalayan Bluetail (Tarsiger rufilatus), version 1.1. In: Billerman, S.M. (Ed. ), Birds of the World. Cornell Lab of Ornithology, Ithaca, NY, USA.
Deveci, D., Marshall, J.M., Egginton, S., 2001. Relationship between capillary angiogenesis, fiber type, and fiber size in chronic systemic hypoxia. Am. J. Physiol. Heart Circ. Physiol. 281, 241–252.
Doiron, M., Gauthier, G., Lévesque, E., 2015. Trophic mismatch and its effects on the growth of young in an Arctic herbivore. Global Change Biol. 21, 4364–4376.
Dormann, C.F., Elith, J., Bacher, S., Buchmann, C., Carl, G., Carré, G., et al., 2013. Collinearity: a review of methods to deal with it and a simulation study evaluating their performance. Ecography 36, 27–46.
DuBay, S.G., Witt, C.C., 2014. Differential high-altitude adaptation and restricted gene flow across a mid-elevation hybrid zone in Andean tit-tyrant flycatchers. Mol. Ecol. 23, 3551–3565.
DuBay, S.G., Wu, Y., Scott, G.R., Qu, Y., Liu, Q., Smith, J.H., et al., 2020. Life history predicts flight muscle phenotype and function in birds. J. Anim. Ecol. 89, 1262–1276.
Dunn, M., Copelston, M., Workman, L., 2004. Trade-offs and seasonal variation in territorial defence and predator evasion in the European Robin Erithacus rubecula. Ibis 146, 77–84.
Egginton, S., 1990. Numerical and areal density estimates of fibre type composition in a skeletal muscle (rat extensor digitorum longus). J. Anat. 168, 73–80.
Haase, I., Liu, Z.W., Zhang, S.M.Y., Dong, Z.H., Cheng, Y.W., Feng, K., et al., 2023. Altitudinal migration behavior patterns of birds on the eastern slope of Mt. Gongga, China. Avian Res. 14, 100114
He, X., Dubay, S., Zhangshang, M., Cheng, Y., Liu, Z., Li, D., et al., 2022. Seasonal elevational patterns and the underlying mechanisms of avian diversity and community structure on the eastern slope of Mt. Gongga. Divers. Distrib. 28, 2459–2474.
Jetz, W., Thomas, G.H., Joy, J.B., Hartmann, K., Mooers, A.O., 2012. The global diversity of birds in space and time. Nature 491, 444–448.
Johnson, J.B., Omland, K.S., 2004. Model selection in ecology and evolution. Trends Ecol. Evol. 19, 101–108.
Körner, C., 2007. The use of 'altitude' in ecological research. Trends Ecol. Evol. 22, 569–574.
Lai, J.S., Zou, Y., Zhang, S., Zhang, X.G., Mao, L.F., 2022. glmm. hp: an R package for computing individual effect of predictors in generalized linear mixed models. J. Plant Ecol. 15, 1302–1307.
Lalla, K.M., Whelan, S., Brown, K., Patterson, A., Jimenez, A.G., et al., 2020. Accelerometry predicts muscle ultrastructure and flight capabilities in a wild bird. J. Exp. Biol. 223, jeb234104
Marden, J.H., 1987. Maximum lift production during takeoff in flying animals. J. Exp. Biol. 130, 235–258.
Meyers, R.A., Stakebake, E.F., 2005. Anatomy and histochemistry of spread-wing posture in birds. 3. Immunohistochemistry of flight muscles and the "shoulder lock" in albatrosses. J. Morphol. 263, 12–29.
Mitoyen, C., Quigley, C., Fusani, L., 2019. Evolution and function of multimodal courtship displays. Ethology 125, 503–515.
Nicolau, P.G., Burgess, M.D., Marques, T.A., Baillie, S.R., Moran, N.J., Leech, D.I., et al., 2021. Latitudinal variation in arrival and breeding phenology of the pied flycatcher Ficedula hypoleuca using large-scale citizen science data. J. Avian Biol. 52, e02646
Rhodes, E.M., Yap, K.N., Mesquita, P.H.C., 2024. Flexibility underlies differences in mitochondrial respiratory performance between migratory and non-migratory White-crowned Sparrows (Zonotrichia leucophrys). Sci. Rep. 14, 9456
Ricklefs, R.E., Wikelski, M., 2002. The physiology/life-history nexus. Trends Ecol. Evol. 17, 462–468.
Rosser, B.W.C., George, J.C., 1985. Histochemical characterization and distribution of fiber types in the pectoralis muscle of the Ostrich (Struthio camelus) and Emu (Dromaius novaehollandiae). Acta Zool 66, 191–198.
Rosser, B.W.C., George, J.C., 1986. The avian pectoralis: histochemical characterization and distribution of muscle fiber types. Can. J. Zool. 64, 1174–1185.
Rowland, L.A., Bal, N.C., Periasamy, M., 2015. The role of skeletal-muscle-based thermogenic mechanisms in vertebrate endothermy. Biol. Rev. Camb. Phil. Soc. 90, 1279–1297.
Scholes, E., Gillis, J.M., Laman, T.G., 2017. Visual and acoustic components of courtship in the bird-of-paradise genus Astrapia (Aves: Paradisaeidae). PeerJ 5, e3987
Schultz, J.D., Hertel, F., Bauch, M., Schlinger, B.A., 2001. Adaptations for rapid and forceful contraction in wing muscles of the male golden-collared manakin: sex and species comparisons. J. Comp. Physiol. 187, 677–684.
Scott, G.R., Egginton, S., Richards, J.G., Milsom, W.K., 2009. Evolution of muscle phenotype for extreme high altitude flight in the bar-headed goose. Proc. R. Soc. B 276, 3645–3653.
Sharma, A., Tripathi, V., Kumar, V., 2022. Control and adaptability of seasonal changes in behavior and physiology of latitudinal avian migrants: insights from laboratory studies in Palearctic-Indian migratory buntings. J. Exp. Zool. Part A 337, 902–918.
Shi, P., 2022. Surface oxygen concentration on the Qinghai-Tibet Plateau (2017-2022). National Tibetan Plateau/Third Pole Environment Data Center. . https://cstr.cn/18406.11.Atmos.tpdc.272423.
Storz, J.F., Scott, G.R., Cheviron, Z.A., 2010. Phenotypic plasticity and genetic adaptation to high-altitude hypoxia in vertebrates. J. Exp. Biol. 213, 4125–4136.
Swanson, D.L., 2010. Seasonal metabolic variation in birds: functional and mechanistic correlates. In: Thompson, C.F. (Ed. ), Current Ornithology. Springer, New York, pp. 75–129.
Tellería, J.L., de la Hera, I., Pérez-Tris, J., 2013. Morphological variation as a tool for monitoring bird populations: a review. ARDEOLA 60, 191–224.
Tobias, J.A., Sheard, C., Seddon, N., Meade, A., Cotton, A.J., et al., 2016. Territoriality, social bonds, and the evolution of communal signaling in birds. Front. Ecol. Evol. 4, 74
van Wessel, T., de Haan, A., van der Laarse, W.J., Jaspers, R.T., 2010. The muscle fiber type–fiber size paradox: hypertrophy or oxidative metabolism? Eur. J. Appl. Physiol. 110, 665–694.
Velten, B.P., Welch, K.C., Ramenofsky, M., 2016. Altered expression of pectoral myosin heavy chain isoforms corresponds to migration status in the white-crowned sparrow (Zonotrichia leucophrys gambelii). R. Soc. Open Sci. 3, 160775
Vernasco, B.J., Emmerson, M.G., Gilbert, E.R., Sewall, K.B., Watts, H.E., 2021. Migratory state and patterns of steroid hormone regulation in the pectoralis muscle of a nomadic migrant, the pine siskin (Spinus pinus). Gen. Comp. Endocrinol. 309, 113787
Welch, K.C., Altshuler, D.L., 2009. Fiber type homogeneity of the flight musculature in small birds. Comp. Biochem. Physiol., B 152, 324–331.
West-Eberhard, M.J., 2003. Developmental Plasticity and Evolution. Oxford University Press, Oxford.
Williamson, J.L., Witt, C.C., 2021. Elevational niche-shift migration: why the degree of elevational change matters for the ecology, evolution, and physiology of migratory birds. Ornithology 138, ukaa087
Xiong, Y., Hao, Y., Cheng, Y., Fan, L., Song, G., Li, D., et al., 2022. Comparative transcriptomic and metabolomic analysis reveals pectoralis highland adaptation across altitudinal songbirds. Integr. Zool. 17, 1162–1178.
Yvon-Durocher, G., Allen, A.P., 2012. Linking community size structure and ecosystem functioning using metabolic theory. Philos. Trans. R. Soc. B 367, 2998–3007.
Zuur, A.F., Ieno, E.N., Elphick, C.S., 2010. A protocol for data exploration to avoid common statistical problems. Methods Ecol. Evol. 1, 3–14.
Table
1.
Species differences in morphological traits, flight muscle fiber phenotypes, experienced temperature, and arrival time.
Trait
F. strophiata
P. frontalis
T. rufilatus
P
η2
Body mass (g)
11.47±0.75A
15.91±1.59B
13.039±1.29C
< 0.001
0.70
N
37
13
17
Body length (mm)
124.61±6.91A
142.46±6.96B
136.588±4.08C
< 0.001
0.59
N
36
13
17
Pectoralis mass (%, relative)
0.13±0.02A
0.11±0.02B
0.11±0.02B
< 0.001
0.31
N
37
13
17
FG fiber mass (%, relative)
0.038±0.01A
0.030±0.01A
0.031±0.01A
0.019
0.03
N
31
12
16
FG FCSA (mm2)
0.0017±0.0004A
0.0011±0.0002B
0.0014±0.0003A
< 0.001
0.31
N
31
12
14
FG FCSA (%, per mass)
0.0148±0.0041A
0.0071±0.0015B
0.0109±0.0027C
< 0.001
0.53
N
31
12
14
FG fiber density (counts/mm2)
191.25±80.80A
240.74±62.67A
246.69±112.26A
0.05
0.08
N
31
12
16
FOG fiber mass (%, relative)
0.095±0.01A
0.085±0.01A
0.075±0.01B
< 0.001
0.30
N
31
12
16
FOG FCSA (mm2)
0.0013±0.0003A
0.0009±0.0001B
0.0011±0.0002A
< 0.001
0.41
N
31
12
14
FOG FCSA (%, per mass)
0.0108±0.0025A
0.0053±0.0007B
0.0085±0.0021C
< 0.001
0.57
N
31
12
14
FOG fiber density (counts/mm2)
592.89±139.89A
891.46±130.97B
629.85±140.50A
< 0.001
0.43
N
31
12
16
FOG/FG
2.71±0.98A
2.95±0.85A
2.49±0.70A
0.39
0.01
N
31
12
14
Capillary density (counts/mm2)
3.37±1.33A
1.73±0.76B
4.607±1.68C
< 0.001
0.31
N
33
9
14
Maximum daily temperature (℃)
13.74±5.10A
7.13±3.80B
11.26±5.13C
< 0.001
0.43
N
105
27
41
Minimum daily temperature (℃)
6.08±2.72A
2.24±2.07B
4.04±3.05C
< 0.001
0.33
N
105
27
41
Arrival date
April 27th±13A
March 31st±13B
April 7th±12C
< 0.001
0.32
N
105
27
41
The mean values, standard deviation, and sample sizes for each trait are reported for each species. Superscript letters denote pairwise statistical differences for a given trait based on post hoc tests following one-way ANOVA, where species with different letters are significantly different at P < 0.05, while species with similar letters are not statistically different from one another for that trait. The effect size of “species” is reported as partial eta squared (η2) for each trait. “FCSA” = fiber cross-sectional area; “relative” = mass of the trait analyzed as a proportion of body mass or body length.
Table
2.
Sex differences in morphological traits, flight muscle fiber phenotypes, experienced temperature, and arrival time.
Trait
F. strophiata female
F. strophiata male
P
η2
P. frontalis female
P. frontalis male
P
η2
T. rufilatus female
T. rufilatus male
P
η2
Body mass (g)
10.86±0.64
11.80±0.59
0.001
0.38
14.71±1.93
16.64±0.73
0.06
0.37
12.42±1.18
13.37±1.26
0.03
0.27
N
13
24
5
8
6
11
Body length (mm)
121.23±5.15
126.52±7.14
0.02
0.13
143.20±5.58
142.00±8.03
0.23
0.01
135.16±3.31
137.36±4.38
0.30
0.07
N
13
23
5
8
6
11
Wing length (%, relative)
7.56±0.75
8.32±0.73
0.01
0.18
8.65±0.53
8.74±0.48
0.79
0.01
7.93±0.92
8.63±0.98
0.24
0.11
N
13
23
5
8
6
11
Pectoralis mass (%, relative)
0.12±0.01
0.14±0.02
< 0.001
0.33
0.11±0.03
0.11±0.01
0.81
0.01
0.10±0.02
0.11±0.02
0.13
0.15
N
13
24
5
8
6
11
FG mass (%, relative)
0.037±0.02
0.039±0.01
0.89
0.03
0.025±0.00
0.033±0.01
0.06
0.24
0.027±0.01
0.033±0.01
0.10
0.11
N
9
22
4
8
6
10
FOG mass (%, relative)
0.082±0.01
0.100±0.01
< 0.001
0.40
0.095±0.02
0.080±0.01
0.04
0.34
0.071±0.01
0.077±0.01
0.36
0.05
N
9
22
4
8
6
10
FG FCSA (%, per mass)
0.0154±0.0063
0.0146±0.0029
0.96
0.03
0.0083±0.0013
0.0064±0.0013
0.08
0.18
0.0109±0.0033
0.0109±0.0026
0.88
0.08
N
9
22
4
8
4
10
FOG FCSA (%, per mass)
0.0117±0.0029
0.0104±0.0022
0.31
0.01
0.0058±0.0008
0.0050±0.0004
0.12
0.13
0.0098±0.0028
0.0080±0.0017
0.25
0.02
N
9
22
4
8
6
10
FOG fiber density (counts/mm2)
585.73±191.97
595.81±117.84
0.69
0.02
925.92±146.14
874.22±129.56
0.55
0.06
630.40±151.04
629.62±144.60
0.8
0.08
N
9
22
4
8
6
10
FG fiber density (counts/mm2)
224.96±130.73
177.46±46.17
0.71
0.02
165.12±10.23
278.54±35.02
0.006
0.64
274.69±187.40
235.49±77.52
0.88
0.08
N
9
22
4
8
6
10
FOG/FG
2.69±1.30
2.72±0.85
0.79
0.03
3.88±0.54
2.49±0.54
0.01
0.11
2.69±0.84
2.40±0.66
0.57
0.06
N
9
22
4
8
6
10
Capillary density (counts/mm2)
3.50±1.21
3.28±1.41
0.72
0.02
1.82±1.06
1.65±0.53
0.75
0.01
5.02±2.48
4.29±0.74
0.45
0.01
N
12
21
4
5
6
8
Maximum daily temperature (℃)
11.01±4.37
14.67±5.00
0.001
0.10
8.44±4.43
6.60±3.40
0.001
0.11
13.80±5.08
9.87±4.63
0.001
0.16
N
21
84
10
17
14
27
Minimum daily temperature (℃)
5.17±1.98
6.39±2.87
0.001
0.03
3.09±2.92
1.89±1.48
0.01
0.02
4.78±3.54
3.64±2.69
0.62
0.00
N
21
84
10
17
14
27
Arrival date
May 1st±10
April 23rd±13
0.01
0.04
April 7th±14
March 27th±11
0.04
0.12
April 8th±11
April 7th±13
0.49
0.01
N
21
84
10
17
14
27
The mean values, standard deviation, and sample sizes for each trait are reported by sex for each species. p-values from one-way ANOVA are bolded when P < 0.05. Partial eta squared effect sizes (η2) are reported by species for each trait. “FCSA” = fiber cross-sectional area; “relative” = mass of the trait analyzed as a proportion of body mass or body length.

 DownLoad:


 Email Alerts
 RSS Feeds