Jiaojiao Wang, Peng Pan, Haijie Zhang, Laikun Ma, Qindong Zhou, Longwu Wang, Jianhua Hou. 2025: Nestlings of two parrotbill species can independently evaluate the presence of predators based on acoustic cues. Avian Research, 16(1): 100217. DOI: 10.1016/j.avrs.2024.100217
Citation:
Jiaojiao Wang, Peng Pan, Haijie Zhang, Laikun Ma, Qindong Zhou, Longwu Wang, Jianhua Hou. 2025: Nestlings of two parrotbill species can independently evaluate the presence of predators based on acoustic cues. Avian Research, 16(1): 100217. DOI: 10.1016/j.avrs.2024.100217
Jiaojiao Wang, Peng Pan, Haijie Zhang, Laikun Ma, Qindong Zhou, Longwu Wang, Jianhua Hou. 2025: Nestlings of two parrotbill species can independently evaluate the presence of predators based on acoustic cues. Avian Research, 16(1): 100217. DOI: 10.1016/j.avrs.2024.100217
Citation:
Jiaojiao Wang, Peng Pan, Haijie Zhang, Laikun Ma, Qindong Zhou, Longwu Wang, Jianhua Hou. 2025: Nestlings of two parrotbill species can independently evaluate the presence of predators based on acoustic cues. Avian Research, 16(1): 100217. DOI: 10.1016/j.avrs.2024.100217
Nest predation is the leading cause of reproductive failure in birds and a major driving force in the evolution of anti-predation strategies. Current studies on the anti-predation strategies of birds driven by predation pressure have mainly focused on adults. However, the detection and behavioral responses of nestlings toward predation risk require further investigation. In this study, we examined nestling responses to predator sounds. Two species of nestlings, the Reed Parrotbill (Paradoxornis heudei) and Vinous-throated Parrotbill (Sinosuthora webbiana), were exposed to the Sparrowhawk (Accipiter nisus, less common) and Oriental Magpie (Pica serica, more common), which are predator species, the Oriental Turtle Dove (Streptopelia orientalis), which is a commonly found harmless species, and background noise. Our findings revealed that compared to pre-playback of natural begging and playback of background noise and Oriental Turtle Dove sounds, playback of the two predator types decreased the total begging time and total number of calls of the two nestlings species, with the calls of the Sparrowhawk leading to greater suppression of nestling begging behavior than those of the Oriental Magpie. Therefore, our results indicated that these nestlings were able to distinguish predators from harmless species based on auditory cues.
Habitat quality plays a crucial role in the survival and reproduction of wild animals. Heavy metal pollution is nonbiodegradable and has spread throughout the environment and resulted in ecosystem changes and endangered wildlife (Alleva et al., 2006; Ali and Khan, 2018). To some extent, wild birds can respond and adapt to metal-polluted environments, which enables them to reproduce and survive in high stress environments (Wingfield and Sapolsky, 2003; Chevin et al., 2010). However, for oviparous animals, higher metal stress may induce lower egg quality (Eeva and Lehikoinen, 1995; Nam and Lee, 2006), and egg quality significantly affects the growth and development of offspring (Whittingham et al., 2007; Forbes and Wiebe, 2010), raising the following question: is the relationship between egg quality and offspring performance affected by environmental metal pollution?
For altricial birds, maternal investment in offspring size can significantly determine the variation in individual fitness (Benton et al., 2005; Krist, 2011). Early life experiences play an important role in determining offspring characteristics and can affect their interactions with the environment, thereby influencing their physiological status and productivity (Dixon et al., 2016). Egg size is positively correlated with several traits, such as hatch rate, across all stages of the offspring life cycle (Roff, 2002). Egg size is a vital feature of breeding and an important determinant of the life cycle of birds; thus, maternal investment in egg size is likely dependent on the relative costs and benefits of investing females versus future offspring (Bernardo, 1996). Egg size may be subjected to constraints and adaptive adjustments, depending on environmental conditions (Tryjanowski et al., 2004; Kvalnes et al., 2013). Therefore, the relationship between egg size and offspring behavior and traits under environmental stress needs to be further investigated (Krist, 2011).
The evolution of speckled eggs has occurred in several avian lineages, and the structural role and function of egg speckling in increasing hatching rates have been found in many wild birds (Gosler et al., 2005; Kilner, 2006). Some significant roles for spottiness include a structural function as a cushion, making the eggshell more resistant when it becomes thinner (Gosler et al., 2005; Hargitai et al., 2013). Spottiness and coloration of eggshell can be used as nondestructive bioassays of egg health. However, environmental pollution also affects eggshell spotting patterns and coloration (Hargitai et al., 2016; Ding et al., 2019). The effects of egg speckling patterns in polluted environments on offspring quality should be further studied.
Many birds can impose handicaps upon their nestlings, including asynchronous hatching and differences in egg size, resulting in inequality among offspring (Forbes, 2009; Forbes and Wiebe, 2010). Such handicaps structure the sibship into advantaged “core” offspring and disadvantaged “marginal” offspring (Hall et al., 2010). Extensive research on breeding species shows that asynchronous incubation is the main disadvantage in sibling competitions and that delayed incubation intervals facilitate asymmetric sibling competition between core and marginal offspring (Glassey and Forbes, 2002). Early hatched, dominant nestlings have access to a greater share of parent-provided food, especially when parents respond to competitive sibling interactions; this is often defined as “core offspring.” Late-hatched nestlings receive less food, unless parents choose to actively feed later-hatched and smaller nestlings; this is often defined as “marginal offspring” (Royle et al., 2002). In some circumstances, females may adaptively allocate resources to eggs according to laying order. For example, increasing resource allocation to eggs according to laying order may allow females to enhance the survival of later-hatching chicks, which may compensate for hatching asynchrony to some extent (Müller et al., 2005; Rosivall et al., 2005). However, previous studies evaluating these effects have relied on natural conditions and have rarely focused on environmental metal pollution.
Passerine birds, including tits and sparrows, can serve as ideal model organisms for indicating environmental metal pollution (Dickens and Hartley, 2007; Mainwaring et al., 2010). The Tree Sparrow (Passer montanus), a widely distributed, sedentary, omnivorous passerine, is a model species for indicating local contamination (Chu and Zheng, 1982; Pan et al., 2008). Metal pollution can negatively affect the reproduction of Tree Sparrow by changing their reproductive and morphological characteristics (Ding et al., 2019, 2022, 2023; Yang et al., 2020). In the present study, we examined the significance of egg size in relation to offspring quality in Tree Sparrows at study sites with low and high metal contamination (Appendix Tables S1 and S2). Furthermore, this study examined the growth and survival of core and marginal offspring in relation to egg size. Moreover, this study aimed to examine the characteristics of core and marginal eggs in the brood, measure the effects of core or marginal status on growth and survival outcomes, and determine the role of asymmetric competition in downstream payoffs for offspring characteristics.
2.
Material and methods
2.1
Study sites and species
Our study was conducted in Silong Town (36°26′ N, 104°23′ E) of Baiyin City (BY), a polluted area located approximately 64.5 km northeast of Lanzhou, Gansu. The main study site was contaminated with industrial wastewater from long-term metal smelting, with Cu, Zn, Pb, and Cd as the main pollutants (Liu, 2003; Wang et al., 2012). A relatively unpolluted site, Weijiachuan village in Liujiaxia Town (LJX) (35°56′N, 103°15′E), located 52.5 km southwest of Lanzhou, was chosen as the compared site. The two sites are 110 km apart and have similar fauna and natural characteristics, predominantly comprising residential areas, farmland, ponds, grassland, orchards, and natural forests (Ding et al., 2020).
During the summer of 2016–2019, we studied the populations of Tree Sparrows bred in nest boxes. They were surveyed from the first week of April to the end of July, with the egg-laying peak occurring from mid-May to early June.
2.2
Experimental procedure
The nest box breeding populations of Tree Sparrows (polluted site: 69 nests; unpolluted site: 72 nests) were studied. Occupied nest boxes (defined as those with nest material) were then checked daily to determine the clutch initiation date and exact egg-laying order. Eggs and nestlings were marked for individual identification, and nest contents were recorded and measured at each census visit. The methods used for measuring egg mass, coloration (lightness, L*; chroma, C*; and hue, h°), spottiness (spotting coverage ratio), and nestling size (body mass, body length, tail length, wing length, tarsus length, toe length, and beak length) have been previously described by Ding et al. (2019, 2020). Egg size was measured according to the laying order. Hatchlings were marked using several color rings for individual identification. Morphological variables were measured daily until the nestlings fledged or accidental death by either predation or parasitic infection occurred.
Female sparrows laid one egg daily in the early morning until the clutch was complete, and interruptions were observed only for 1–2 days during rare inclement weather, such as rainstorms. We found that most nestlings hatched early in the morning and that broods in the sparrow population hatched asynchronously, with a general 2-day age difference between the oldest and youngest nestlings and 3 days in special cases. Core nestlings are defined as eggs that hatch on the first day of nestling in a given nest, whereas marginal nestlings are those born after a day of brooding (Forbes et al., 1997; Forbes and Wiebe, 2010). Therefore, we assigned each egg the same core/marginal status in relation to the hatchling. The core or marginal status was often evaluated by counting the number of hatchings on the first day of nestling. The nest box was checked daily, and if pipped eggs were found, the nest was usually checked later in the day. If the nest was not checked for special reasons, including a rainstorm, the hatched nestlings were assigned to the core nestlings early the next morning. In unclear cases, the hatching mass was assessed relative to the egg mass, as egg mass and hatching are highly correlated. According to a study by Forbes and Wiebe (2010), if the nestling mass exceeds 92% of the egg mass and more than half of the average growth difference (1.9 g) between 1-day-old and 2-day-old nestlings, the nestling is considered to have hatched the previous day and assigned a core or marginal status accordingly.
2.3
Egg and nestling performance
Because the mean nestling period is approximately 14 days, we examined the relationship between initial egg size and nestling mass at three time points during nestling: 1, 5, and 10 days of age. The day 1 mass (i.e., mass on the day of hatching) was used to estimate the effect of egg mass on hatchling mass; the day 5 mass provided an interim report on nestling development; and the day 10 mass provided a measure of nestling size as the individuals approached fledgling age.
The nest box was usually checked on the first day of nestling, and it was found that two or more core nestlings were present simultaneously and that it was impossible to determine from which egg the chicks hatched. For the corresponding combinations of eggs and nestlings, marginal nestlings normally hatch at 1-day intervals. This identification process was relatively simple; however, for core nestlings that hatched more or less simultaneously, assigning hatching to eggs was more difficult. Data showed that most of the core nestlings that could be assigned to an individual egg were from broods with single core offspring, a brooding structure accounting for a minor population. Therefore, we pooled data on core and marginal nestlings in subsequent analyses (mean values in core and marginal nestlings).
2.4
Statistical analyses
Statistical analyses were conducted using SPSS version 22.0 for Windows (SPSS, New York, USA) and OriginPro version 2022 for Windows (OriginLab Corporation, Northampton, USA). The normality of data distribution was checked using the Kolmogorov–Smirnov test. Differences in the parameters of sparrows between the polluted and unpolluted sites were determined using an independent sample one-way analysis of variance. The Mann–Whitney U test was used if the data were nonnormally distributed. Pearson’s product-moment correlation with Bonferroni’s correction was used for multiple comparisons. Logistic regression was used to examine the relationship between egg mass and nestling survival, including hatching and fledgling rates. To facilitate simple comparisons, the same full multiple regression model was fitted to all datasets. A significance level of P < 0.05 was considered statistically significant. All values are expressed as mean ± standard deviation.
Preliminary correlation analyses were performed to determine the degree of collinearity among various variables, including body size. Principal component analysis (PCA) was used to exclude correlated variables. PCA was used to reduce these variables to a single descriptor of nestling body size (body mass, body length, wing length, tarsus length, toe length, and beak length) (1-, 5-, and 10-day-old core and marginal nestlings). All morphological variables were loaded heavily on the first PC axis, accounting for 44.66%–72.36% of the variation in nestling morphology (Appendix Tables S3 and S4). Therefore, the PC axis scores served as an index of body size in subsequent analyses.
3.
Results
3.1
Core and marginal offspring characteristics
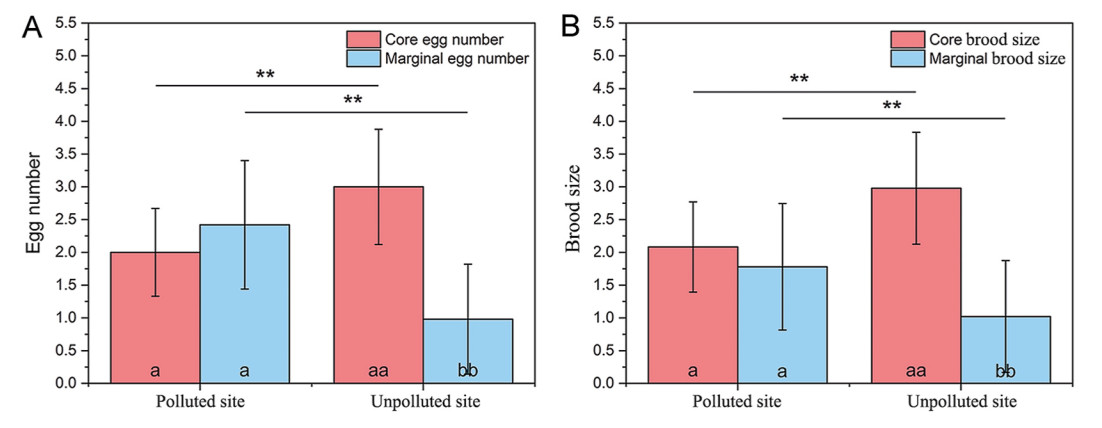
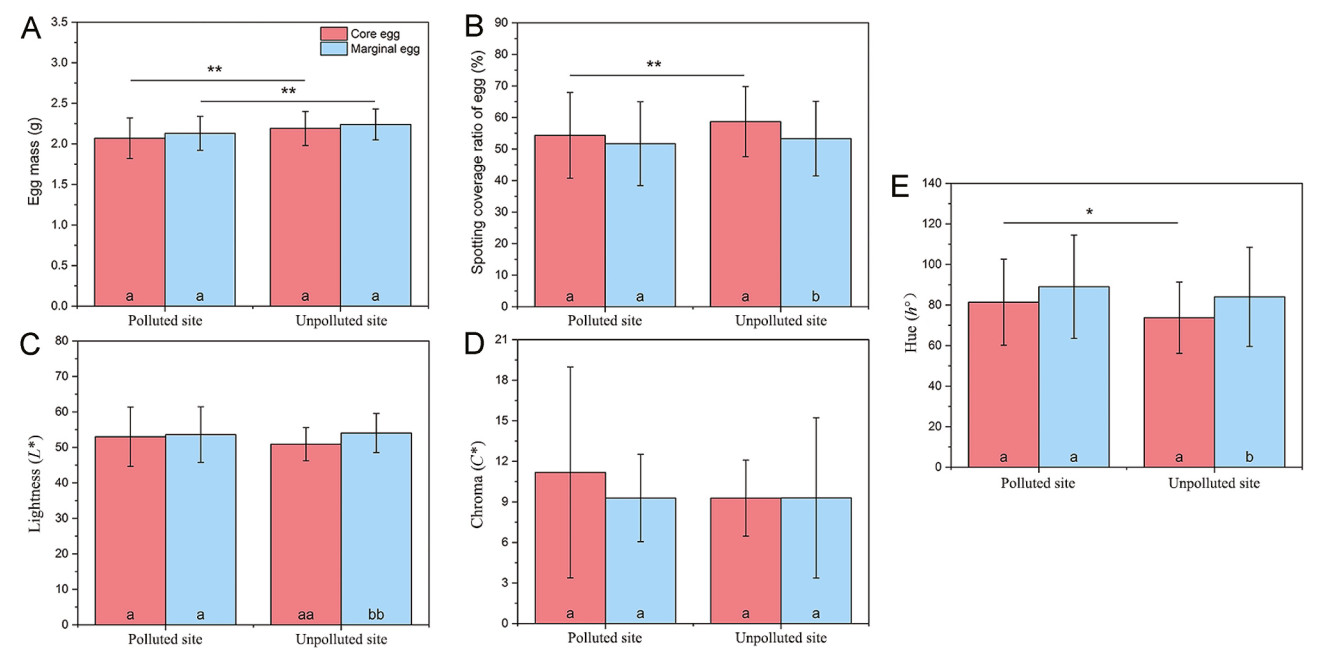
In this study, the number of core eggs was lower (F = 26.863, P < 0.001), whereas the number of marginal eggs was higher (F = 44.011, P < 0.001) at the polluted site than those at the unpolluted site (Fig. 1A). Both the core (F = 9.568, P = 0.002) and marginal eggs (F = 5.781, P = 0.018) were significantly heavier at the unpolluted site than at the polluted site (Fig. 2A). A lower eggshell spotting coverage ratio and greater hue (h°) of core eggs were observed at the polluted site than at the unpolluted site (F = 3.470, P < 0.049), but no differences in lightness (L*) and chroma (C*) were detected between the two study sites (F < 3.474, P > 0.065) (Fig. 2B–E).
Figure
1.
Comparison of core and marginal egg numbers (A) and brood sizes (B) between the two study sites (**: P < 0.01). Different symbols on the bars representing the same site indicate statistical differences between the two groups of eggs and nestlings (a, a: P > 0.05; aa, bb: P < 0.01).
Figure
2.
Comparison of the egg characteristics of the core and marginal eggs (A: egg mass; B: spotting coverage ratio; C: lightness (L*); D: chroma (C*); E: hue (h°)) between the two study sites (*: P < 0.05; **: P < 0.01). Different symbols on the bars representing the same site indicate significant statistical differences between the two egg groups (a, a: P > 0.05; a, b: P < 0.05; aa, bb: P < 0.01).
The number and morphological characteristics of the core and marginal nestlings differed significantly between the two study sites. Fewer core nestlings (F = 32.404, P < 0.001) and more marginal nestlings (F = 16.613, P < 0.001) were found at the polluted site than at the unpolluted site (Fig. 1B). Most morphological characteristics of the 1-, 5-, and 10-day-old core and marginal nestlings at the polluted site were significantly lower than those at the unpolluted site (F > 4.865, P < 0.029) (Table 1). Core and marginal nestlings at the polluted site showed a higher body length growth rate than those at the unpolluted site (core: F = 5.396, P = 0.021; marginal: F = 5.284, P = 0.026), but not in other traits (F < 2.075, P > 0.152) (Table 1).
Table
1.
Body size of the core and marginal nestlings at the two study sites (mean ± SD).
Age
Nestling status
Study site
Body mass (g)
Body length (mm)
Tail length (mm)
Wing length (mm)
Tarsus length (mm)
Toe length (mm)
Beak length (mm)
1-day-old
Core
Polluted
2.89 ± 0.77
35.93 ± 2.25**
0.92 ± 0.30**
6.53 ± 0.57
6.41 ± 0.66
4.29 ± 0.42
3.43 ± 0.43*
Unpolluted
3.04 ± 0.54
37.96 ± 2.16
1.66 ± 0.49
6.56 ± 0.56
6.37 ± 0.43
4.50 ± 0.52
3.66 ± 0.39
Marginal
Polluted
2.61 ± 0.73
35.42 ± 2.30*
1.03 ± 0.42
6.39 ± 0.73
6.36 ± 0.62
4.32 ± 0.57
3.46 ± 0.39
Unpolluted
2.68 ± 0.61aa
36.84 ± 2.65a
1.31 ± 0.51
6.32 ± 0.73
6.10 ± 0.65a
4.31 ± 0.58
3.51 ± 0.39
5-day-old
Core
Polluted
10.41 ± 1.77**
54.96 ± 4.25**
2.92 ± 1.10**
13.99 ± 2.32**
12.35 ± 1.26**
8.74 ± 1.17**
5.64 ± 0.81
Unpolluted
11.74 ± 1.83
57.35 ± 4.19
3.50 ± 1.05
15.49 ± 2.80
12.99 ± 1.36
9.73 ± 1.25
5.60 ± 0.62
Marginal
Polluted
9.08 ± 2.71aa
53.21 ± 4.47a
2.74 ± 1.20
13.17 ± 2.51*a
11.95 ± 1.64
8.47 ± 1.35*
5.79 ± 0.87**
Unpolluted
9.34 ± 2.33aa
53.90 ± 5.39aa
2.96 ± 1.19a
14.38 ± 3.05a
12.11 ± 1.43aa
9.28 ± 1.65
5.32 ± 0.44a
10-day-old
Core
Polluted
17.16 ± 2.14**
81.86 ± 6.67**
17.34 ± 3.89**
36.89 ± 4.78**
36.96 ± 3.91**
11.58 ± 0.68**
7.04 ± 0.62*
Unpolluted
19.01 ± 2.33
85.32 ± 5.66
19.43 ± 3.92
39.32 ± 4.42
17.50 ± 0.64
12.08 ± 1.03
7.23 ± 0.58
Marginal
Polluted
15.63 ± 3.17*aa
77.75 ± 8.26*aa
15.04 ± 4.32aa
34.34 ± 5.97aa
16.60 ± 1.17*a
11.30 ± 0.82**a
6.86 ± 0.68
Unpolluted
17.05 ± 2.93aa
81.07 ± 6.27aa
16.57 ± 4.39aa
36.24 ± 6.31aa
17.12 ± 1.04a
12.02 ± 1.13
7.08 ± 0.60
Growth rate
Core
Polluted
0.55 ± 0.21
0.19 ± 0.12*
0.48 ± 0.14
0.34 ± 0.10
0.44 ± 0.11
0.52 ± 0.17
0.30 ± 0.15
Unpolluted
0.55 ± 0.14
0.16 ± 0.05
0.48 ± 0.11
0.34 ± 0.06
0.43 ± 0.13
0.51 ± 0.16
0.27 ± 0.12
Marginal
Polluted
0.54 ± 0.26
0.20 ± 0.08*
0.44 ± 0.14
0.33 ± 0.06
0.42 ± 0.19
0.45 ± 0.16
0.29 ± 0.20
Unpolluted
0.48 ± 0.10a
0.16 ± 0.05
0.45 ± 0.10
0.32 ± 0.05a
0.39 ± 0.11
0.50 ± 0.16
0.25 ± 0.07
*: P < 0.05 compared to unpolluted site population; **: P < 0.01 compared to unpolluted site population. a: P < 0.05 compared to core nestling in the same population; aa: P < 0.01 compared to core nestling in the same population.
The number of the core and marginal eggs and nestlings differed significantly at the unpolluted site (F = 123.672, P < 0.001), but not at the polluted site (F = 3.138, P = 0.080) (Fig. 1). A greater eggshell spotting coverage ratio and L* value and lower h° value were found for the core eggs than for the marginal eggs at the unpolluted site (F > 3.896, P < 0.047) (Fig. 2B–E). Except for 1-day-old nestlings at the polluted site, there were differences between the body sizes of 1-, 5-, and 10-day-old core and marginal nestlings at the same study site (polluted site: F > 3.431, P < 0.048; unpolluted site: F > 3.800, P < 0.046). The growth rates of body mass and wing length were greater for the core nestlings than for the marginal nestlings at the unpolluted site (body mass: F = 5.912, P = 0.016; wing length: F = 3.674, P = 0.048), but there was no difference in the other parameters at the two study sites (F < 2.638, P > 0.108) (Table 1).
3.2
Variation in egg characteristics within clutches
The differences in egg measurements across the laying orders in the samples were relatively large. More obvious differences in egg characteristics were observed for larger clutch sizes (Appendix Figs. S1–S5). The differences in egg mass, eggshell spotting coverage ratio, and chroma content in the six-egg clutches between the maximum and minimum values were approximately 9.49% (unpolluted site), 35.59% (unpolluted site), and 31.23% (polluted site), respectively (Appendix Table S5). Greater differences in L* and h° values of the eggs were found in the five-egg clutches at the polluted site and the six-egg clutches at the unpolluted site (L*, polluted site: 16.62%, unpolluted site: 20.99%; h°, polluted site: 21.91%, unpolluted site: 25.62%; Appendix Table S5).
Comparison of egg mass with laying order between the two study sites revealed that the egg mass of the 4th egg of the four-egg clutches was significantly greater at the unpolluted site than at the polluted site (F = 4.806, P = 0.048) (Appendix Fig. S1). Higher eggshell spotting coverage ratios were found for the 4th egg in the four-egg clutches (F = 6.074, P = 0.021) and the 2nd egg in the five- and six-egg clutches at the unpolluted site (F > 2.919, P < 0.048) (Appendix Fig. S2). No differences in lightness were found between the two study sites (F > 3.158, P > 0.113) (Appendix Fig. S3). Egg chroma was greater in the five-egg clutches at the polluted site (F > 3.056, P < 0.048) (Appendix Fig. S4). Egg hue was greater in the three-egg clutches at the unpolluted site (F > 60.243, P < 0.001) (Appendix Fig. S5).
Analyses of the relationships between laying order and egg measurements revealed that later-laid eggs had a lower eggshell spotting coverage ratio and greater lightness on the shell surface than earlier-laid eggs within a clutch at the two study sites (eggshell spotting coverage ratio: R2 > −0.410, P < 0.003; lightness: R2 > 0.301, P < 0.044) (Appendix Table S6). An increased egg hue in the six-egg clutches with laying order was observed only at the unpolluted site (R2 = 0.475, P = 0.001). However, no obvious trends in egg mass or chroma with laying order were observed at the two study sites (egg mass: R2 > −0.024, P > 0.174; chroma: R2 > −0.207, P > 0.103) (Appendix Table S6).
3.3
From eggs to nestlings
Egg and hatchling masses were unrelated at the polluted site (R2 < 0.106, P > 0.226), but the initial marginal egg mass and hatching mass of marginal nestlings were positively correlated at the unpolluted site (R2 = 0.451, P = 0.024) (Appendix Table S7). On day 1 of nestling, the effects of asymmetric sibling rivalry were not evident. Only 1-day-old core nestling size (PC1) was strongly linked to the initial mean egg core mass at the unpolluted site (β = 4.504, P = 0.014), but no effect was found at the polluted site (Table 2). The size (PC1) of the 5-day-old core nestlings was related to clutch size (β = 0.777, P = 0.048), initial mean egg core mass (β = 5.056, P = 0.005), and core brood size at hatching (β = −0.773, P = 0.036) at the unpolluted site, but no relationship was found at the polluted site (Table 2). No effect was found for the 10-day-old core nestlings at the two study sites, and only the mean mass of the marginal eggs and brood sizes at hatching positively affected the marginal nestling size (PC1) at the unpolluted site (β > 0.863, P < 0.005) (Table 3). The hatch day and mean eggshell spotting coverage ratio of the core eggs (%) did not affect the 1-, 5-, and 10-day-old nestling size (PC1) at the two study sites (Tables 2 and 3).
Table
2.
Multiple regression analysis of the relationship between nestling size (PC1) of the 1-, 5-, and 10-day-old core nestlings and developmental and phenotypic variables.
Study site
Independent variable
Day 1
Day 5
Day 10
β
SE
P
β
SE
P
β
SE
P
Polluted
Constant
−5.265
5.388
0.432
3.625
4.612
0.448
−0.276
4.639
0.954
Hatch date
0.160
0.594
0.813
−0.074
0.529
0.891
−0.056
0.546
0.920
Clutch size
−0.791
1.044
0.528
0.628
0.647
0.352
0.584
0.626
0.371
Mean mass of core eggs(g)
2.465
5.032
0.673
−1.929
1.578
0.247
−0.227
1.551
0.886
Mean spotting coverage ratio of core eggs (%)
−3.936
3.411
0.368
−0.040
2.275
0.986
1.986
1.989
0.339
Core brood size at hatching
1.513
1.526
0.426
−0.563
0.715
0.447
−0.502
0.648
0.455
Marginal brood size at hatching
1.041
1.260
0.496
−0.377
0.543
0.502
−0.759
0.516
0.170
Unpolluted
Constant
−8.541
3.044
0.038
−14.763
3.749
0.003
−1.787
3.921
0.655
Hatch date
−0.339
0.764
0.676
0.184
0.505
0.723
−0.841
0.558
0.152
Clutch size
0.147
0.452
0.758
0.777
0.345
0.048
0.417
0.384
0.295
Mean mass of core eggs (g)
4.504
1.206
0.014
5.056
1.422
0.005
2.303
1.432
0.129
Mean spotting coverage ratio of core eggs (%)
2.093
2.077
0.360
1.169
2.410
0.638
1.453
2.644
0.591
Core brood size at hatching
−0.531
0.312
0.149
−0.773
0.319
0.036
−0.398
0.332
0.249
Marginal brood size at hatching
−0.054
0.252
0.837
−0.288
0.246
0.269
−0.227
0.288
0.443
β, the SE of β and the P value of a Student’s t-test of β are shown. Overall significance of the regression: polluted site: day 1, F = 1.389, P = 0.476, R2 = 0.650; day 5, F = 0.403, P = 0.862, R2 = 0.180; day 10, F = 0.502, P = 0.795, R2 = 0.215; unpolluted site: day 1, F = 3.381, P = 0.101, R2 = 0.802; day 5, F = 3.724, P = 0.033, R2 = 0.691; day 10, F = 1.052, P = 0.432, R2 = 0.296.
Table
3.
Multiple regression analysis of the relationship between nestling size (PC1) of the 1-, 5-, and 10-day-old marginal nestlings and developmental and phenotypic variables.
Study site
Independent variable
Day 1
Day 5
Day 10
β
SE
P
β
SE
P
β
SE
P
Polluted
Constant
1.852
4.279
0.707
−2.773
5.073
0.598
−10.023
5.207
0.090
Hatch date
−0.004
0.503
0.995
0.121
0.614
0.848
0.903
0.631
0.190
Clutch size
0.484
0.642
0.530
0.309
0.802
0.709
0.126
0.802
0.879
Mean mass of marginal eggs (g)
−4.047
2.243
0.213
0.421
2.139
0.848
2.931
2.664
0.303
Mean spotting coverage ratio of marginal eggs (%)
−1.954
4.277
0.693
0.572
2.307
0.810
0.600
3.167
0.854
Core brood size at hatching
1.423
1.162
0.345
−0.320
0.699
0.658
−0.760
0.910
0.428
Marginal brood size at hatching
1.341
0.711
0.200
0.074
0.536
0.893
−0.457
0.546
0.427
Unpolluted
Constant
−5.302
4.995
0.329
−9.215
9.449
0.385
−4.167
2.012
0.077
Hatch date
0.212
0.931
0.828
−0.182
1.916
0.929
−0.040
0.237
0.872
Clutch size
−0.579
0.527
0.314
−0.601
0.871
0.528
−0.319
0.184
0.127
Mean mass of marginal eggs (g)
2.455
1.443
0.140
4.739
3.276
0.222
2.483
0.619
0.005
Mean spotting coverage ratio of marginal eggs (%)
−0.605
2.665
0.828
−0.306
4.941
0.954
−0.477
1.039
0.660
Core brood size at hatching
0.135
0.332
0.699
0.286
0.847
0.753
−0.221
0.134
0.145
Marginal brood size at hatching
0.857
0.471
0.119
1.215
1.253
0.387
0.863
0.183
0.002
β, the SE of β and the P value of a Student’s t-test of β are shown. Overall significance of the regression: polluted site: day 1, F = 1.704, P = 0.415, R2 = 0.836; day 5, F = 0.487, P = 0.803, R2 = 0.245; day 10, F = 1.079, P = 0.447, R2 = 0.447; unpolluted site: day 1, F = 0.999, P = 0.501, R2 = 0.500; day 5, F = 0.562, P = 0.749, R2 = 0.457; day 10, F = 9.324, P = 0.005, R2 = 0.889.
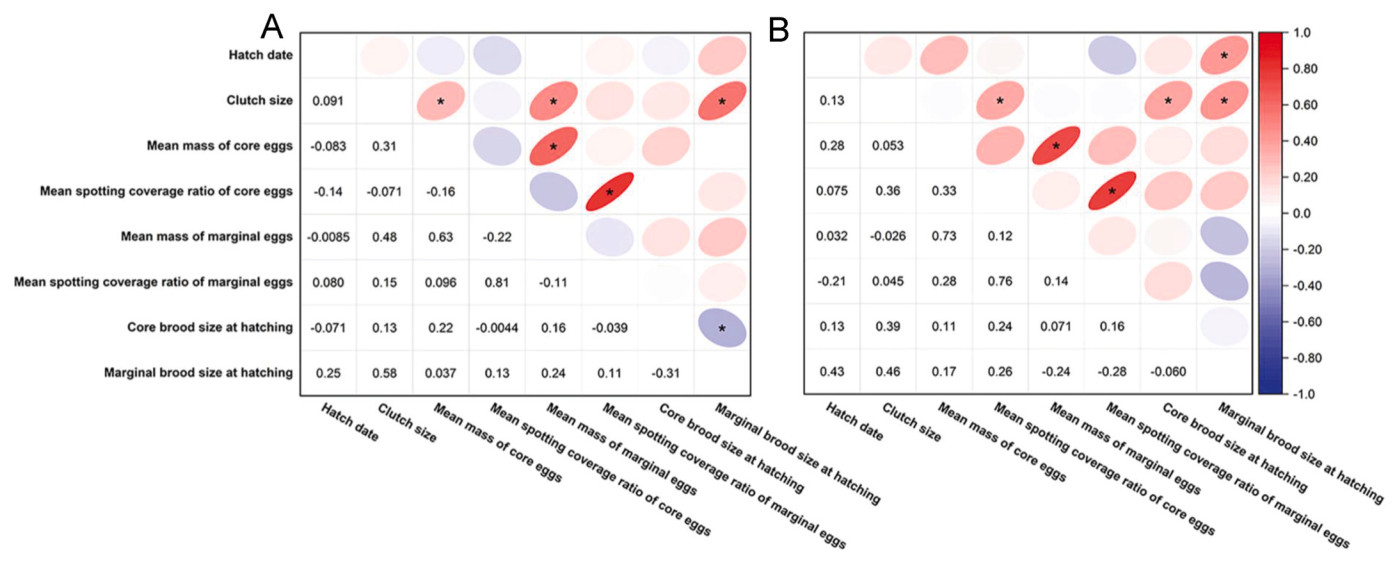
The hatching date was positively related to the marginal brood size at hatching at the unpolluted site (R2 = 0.425, P = 0.015). Moreover, positive correlations were observed between clutch size and the mean mass of core and marginal eggs and marginal brood size at hatching at the polluted site (R2 > 0.287, P < 0.042). A positive correlation was also observed between clutch size and core and marginal brood sizes at hatching at the unpolluted site (R2 > 0.387, P < 0.009). The mean mass and eggshell spotting coverage ratio of core eggs were positively related to the mean mass and eggshell spotting coverage ratio of marginal eggs at the two study sites (R2 > 0.627, P < 0.001). Conversely, the core brood size at hatching was negatively related to the marginal brood size at hatching at the polluted site (R2 = −0.309, P = 0.031) (Fig. 3).
Figure
3.
Relationships among hatch date, clutch size, egg characteristics of the core and marginal eggs, and core and marginal brood sizes at hatching at the two study sites (A: polluted site; B: unpolluted site). *: P < 0.05; the number: correlation coefficient.
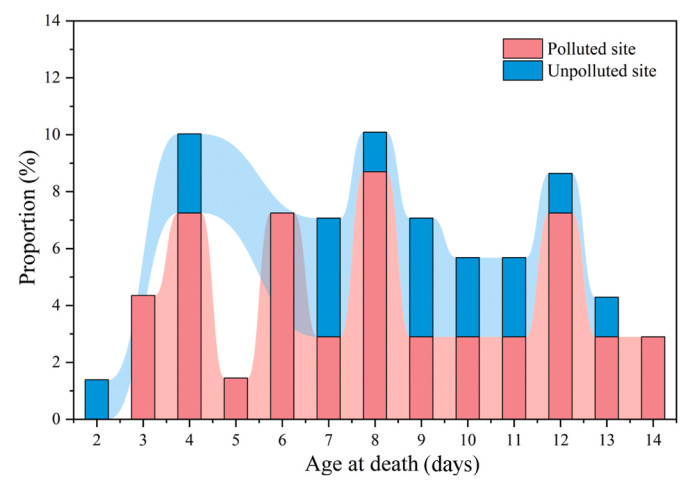
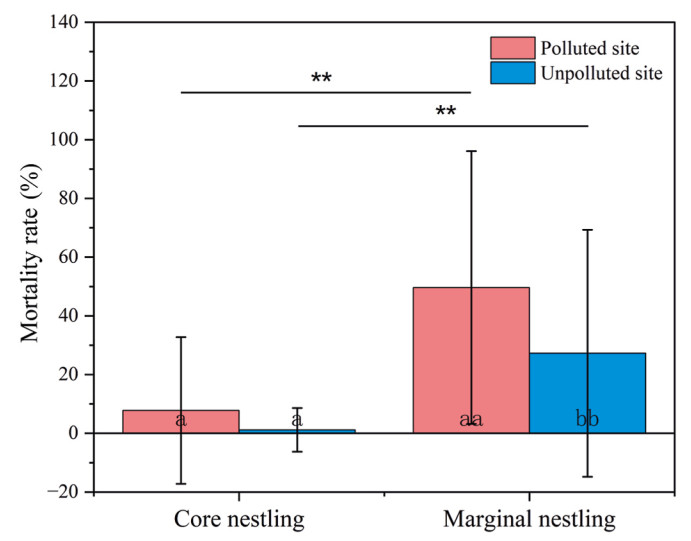
The proportion of nests where mortality occurred peaked three times at the polluted site (4–6, 8, and 12 days old) and once at the unpolluted site (7–9 days old) (Fig. 4). The proportion of nests where mortality occurred was significantly higher at the polluted site (F = 5.171, P = 0.035). The mortality rate of marginal nestlings was higher at the polluted site (Z = −2.387, P = 0.017). The mortality rate of marginal nestlings was higher than that of core nestlings at the two study sites (polluted site: Z = −4.801, P < 0.001; unpolluted site: Z = −3.713, P < 0.001) (Fig. 5).
Figure
4.
Proportion of nests where mortality occurred daily during nestling.
Figure
5.
Comparison of the mortality rate of core and marginal nestlings between the two study sites. Different symbols on bars indicate statistical differences between the two sites (a, a: P > 0.05; aa, bb: P < 0.01; **: P < 0.01).
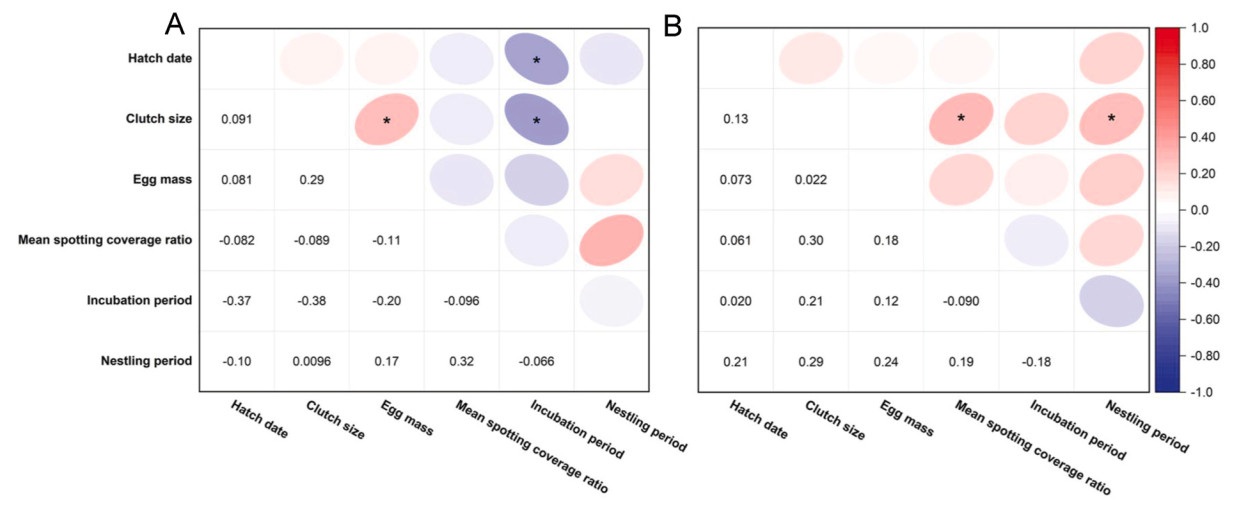
Multiple regression analysis revealed that development and phenotypic variables did not affect the hatching rates at the two study sites (β > −0.404, P > 0.163) and the fledgling rate at the unpolluted site (β > −0.118, P > 0.117). The mean eggshell spotting coverage ratio, incubation period, and nestling period had significant negative effects on the fledgling rate of nestlings at the polluted site (β > −0.152, P < 0.038) (Table 4). Furthermore, the hatch date was negatively correlated to the incubation period at the polluted site (R2 = −0.370, P = 0.047). Clutch size was positively correlated to egg mass (R2 = 0.287, P = 0.042) and negatively correlated to the incubation period at the polluted site (R2 = −0.382, P = 0.048), whereas it was positively correlated to the mean eggshell spotting coverage ratio and nestling period at the unpolluted site (R2 > 0.334, P < 0.035) (Fig. 6).
Table
4.
Multiple regression analysis of the relationship among hatching rate, fledgling rate, and developmental and phenotypic variables.
Figure
6.
Relationships among hatch date, clutch size, incubation period, egg mass, mean spotting coverage ratio, and nestling period at the two study sites (A: polluted site; B: unpolluted site). *: P < 0.05; the number: correlation coefficient.
4.1
Variation in core and marginal egg characteristics
Among life-history traits, a tradeoff between the number and size of propagules is a very common pattern in most taxa (Roff, 2002). Most altricial birds build structured families by imposing handicaps upon certain progeny—the marginal offspring—while conferring advantages to others—the core brood—such as differences in egg or nestling size and, most importantly, development asynchrony (Forbes and Wiebe, 2010; Hall et al., 2010). In this study, the broods were decomposed into core and marginal elements. We detected a lower number of core eggs and a higher number of marginal eggs at the polluted site. The number of core eggs was significantly higher than that of marginal eggs at the unpolluted site. We also found greater core and marginal egg masses at the unpolluted site than at the polluted site. One possible explanation is that sparrows adopt a bet-hedging strategy that unequally divides within-clutch resources to avoid investing in eggs with poor survival prospects (Crean and Marshall, 2009). Alternatively, this may contribute to the development of an offspring size hierarchy in which females can select the best condition depending on sibling competition (Smith and Bruun, 1998), thereby ensuring normal hatching at the polluted site. Furthermore, higher heavy metal enrichment or pollution pressure can decrease maternal and egg quality (thinner eggshell thickness) (Ding et al., 2019), resulting in a decrease in the number and size of eggs at the polluted site.
The pronounced red‒brown spotting of eggs laid by many passerine species is attributed to protoporphyrin pigments (Baird et al., 1975), which have a structural function as a cushion, thereby making the eggshell more resistant (Gosler et al., 2005; Hargitai et al., 2013). In this study, there were greater eggshell spotting coverage ratios for the core eggs and lower hue values for the marginal eggs at the unpolluted site than at the polluted site. A lower eggshell spotting coverage ratio and greater lightness and hue values were also observed for the marginal eggs at the unpolluted site. The shells of the core eggs were much darker, and the hue tended to be more red–brown than that of the marginal eggs at the unpolluted site, indicating that these eggs contained higher protoporphyrin concentrations (Poláček et al., 2017). In a previous study, the mean eggshell spotting coverage ratio was significantly correlated with eggshell thickness at the unpolluted site (Ding et al., 2019). This suggests that core eggs have a greater structural composition advantage than marginal eggs, and this advantage is more obvious at the unpolluted site.
Variation in egg size among different clutch sizes is an important mechanism by which females adjust their reproductive patterns depending on their environmental and body conditions (Smith and Bruun, 1998; Yosef and Zduniak, 2008). A previous study on Tree Sparrows revealed that only clutch size affected egg volume at polluted site (Ding et al., 2019). This study revealed that clutch size was positively related to core and marginal egg masses at the polluted site, but the egg mass of large egg clutches varied more than that of small egg clutches. The lower variability in egg mass among small clutch sizes at the polluted sites may indicate that parents were more confident in their ability to successfully produce offspring in small clutch sizes.
In oviparous females, the transfer of maternal resources is critical for reproductive and offspring viability. However, these distributions are uneven, and given that female birds lay eggs over an extensive period, some differences in egg quality or chemical composition seem physiologically justified in terms of laying order (Van Dyke et al., 2013; Orłowski et al., 2016). The findings of the present study revealed a significantly decreased eggshell spotting coverage ratio and increased eggshell lightness according to the laying orders at the two study sites (Appendix Figs. S2 and S3). In terms of eggshell coloration, the last eggs laid within a clutch had a greater proportion of white eggs (Appendix Fig. S6). These results are consistent with those of other studies on the House Sparrow (Passer domesticus) and Common Kestrel (Falco tinnunculus) (López de Hierro and De Neve, 2010; Martínez-Padilla et al., 2010). Although decreased egg pigmentation indicates a limitation of pigment deposition, increased egg pigmentation may indicate an increase in investments in last-laid eggs, facilitating the survival of last-hatched nestlings (Slagsvold et al., 1984). We found greater variations in the eggshell spotting coverage ratios and coloration and greater uneven distributions in larger clutches than in small clutches (Appendix Table S5). These results suggest that at least in the short term, protoporphyrin deposition is limited in females.
4.2
Variation of core and marginal nestling characteristics
Nestlings are often used as bioindicators to monitor local pollution in foraging areas (Eeva et al., 2009; Ding et al., 2020). Core chicks are generally given priority for food by their parents, consequently enjoying faster growth (Hall et al., 2010). The core and marginal nestlings at the polluted site had lower body mass and size than those at the unpolluted site; however, no difference in growth rate of most body characteristics were observed. A comparison of the body sizes of the core and marginal nestlings at the same site revealed no difference between the 1-day-old nestlings, but this difference became more significant with an increase in nestling age.
The differences in the growth rates of body mass and wing length were significant between core and marginal nestlings at the unpolluted site, with none found in the other characteristics at the two study sites. The mortality rate of marginal nestlings was significantly different between the two study sites. It is believed that core nestlings are more likely to achieve their growth potential than marginal nestlings due to their competitive advantage. The core nestlings also had a significantly lower mortality rate than marginal nestlings at the two study sites. However, the marginal nestlings that survived fledgling were not significantly different from their core counterparts. Therefore, these observations are consistent with the quality assurance hypothesis that explains avian hatching asynchrony (Amundsen and Slagsvold, 1996).
4.3
Effect of egg characteristics on nestling survival
Egg characteristics are vital life-history traits for breeding under maternal control and are commonly considered important indicators of egg and offspring quality (Kvalnes et al., 2013; Hargitai et al., 2016). These traits are used as early indicators of changes in the reproduction, growth, and nestling survival of birds (Tuan et al., 1991; Christians, 2002). In this study, egg size was a better predictor of nestling conditions at the unpolluted site. Initial egg mass was related to the size of 1- and 5-day-old core nestlings and 10-day-old marginal nestlings at the unpolluted site. These findings support the observations of Forbes and Wiebe (2010), who reported that the effect of initial egg mass on survival was manifested in offspring. In unpolluted areas, large eggs appear to benefit progeny primarily by providing sufficient resources that allow them to become established in the brood immediately following hatching. A positive correlation between core egg and nestling sizes as well as between marginal egg and nestling sizes was found at the unpolluted site. Given that marginal offspring have a lower competition level than typical core offspring, it is reasonable to assume that sibling competition will be protected from the effects of external ecological conditions (Forbes et al., 1997; Forbes and Wiebe, 2010).
In the present study, the core egg mass and brood size at hatching positively and negatively influenced the core nestling size at 1 and 5 days, respectively, at the unpolluted site. These effects become measurable at these ages because the number of core offspring that succumb to brood reduction is small (Reed et al., 1999). Similarly, a positive effect of marginal egg mass was related to the size of 10-day-old marginal nestlings. However, interestingly, brood size at hatching had a significant negative effect on marginal nestling size. Likely, the slowest-growing individuals are gradually eliminated via brood reduction. However, it should be noted that the number of marginal nestlings at the unpolluted site was small, and the number of surviving marginal nestlings may offset the impact of core nestlings on them. Thus, marginal brood size correlates positively with marginal nestling size.
The maternal allocation of resources to eggs significantly affects nestling development and growth (Whittingham et al., 2007). Clutch size was positively related to brood sizes at hatching at the unpolluted site and to marginal brood size at hatching at the polluted site. The masses of the core and marginal eggs were unrelated to brood size at hatching at the two study sites. In the present study, the eggshell spotting coverage ratio was positively related with the fledgling rate at the polluted site. This may indicate that protoporphyrin speckling acts as a strengthening agent for the eggshell structure and contributes to improved embryo development (Hargitai et al., 2013). Second, heavily speckled eggs may signal a female’s ability to endure high stress levels or effectively remove stressors and indicate good health (Moreno and Osorno, 2003).
5.
Conclusions
The findings of this study suggest that variation in egg characteristics exerts differential effects on the growth and survival of core and marginal progeny. Moreover, the effects of egg characteristics on the offspring of Tree Sparrows in polluted areas were not obvious, providing some respite to wild birds that survive pollution-induced stress; however, adverse effects on survival and reproduction remain. Therefore, our findings underscore the importance of conducting long-term avian ecotoxicology field studies.
The experiments were approved by the Ethical Committee of Animal Experiments of School of Life Sciences, Lanzhou University.
Declaration of competing interest
The authors declare that they have no known competing financial interests or personal relationships that could have appeared to influence the work reported in this paper.
Acknowledgements
We thank Hao Sun, Lize Zhang, Xiaojuan Bai, Shiwei Ai, and Rui Guo for their help in the fieldwork and element analysis. We also thank Nesediting (www.nesediting.cn) for English language editing.
Amo, L., Galván, I., Tomás, G., Sanz, J.J., 2008. Predator odour recognition and avoidance in a songbird. Funct. Ecol. 22, 289–293.
Barati, A., McDonald, P.G., 2017. Nestlings reduce their predation risk by attending to predator-information encoded within conspecific alarm calls. Sci. Rep. 7, 11736.
Berger, J., Swenson, J.E., Persson, I.-L., 2001. Recolonizing carnivores and naive prey: conservation lessons from Pleistocene extinctions. Science 291, 1036–1039.
Bernath-Plaisted, J., Yasukawa, K., 2011. Effect of alarm calling by male Red-winged Blackbirds on nestling begging and female provisioning behavior. J. Field Ornithol. 82, 395–405.
Briskie, J.V., Martin, P.R., Martin, T.E., 1999. Nest predation and the evolution of nestling begging calls. Proc. R. Soc. B 266, 2153–2159.
Carlson, N.V., Healy, S.D., Templeton, C.N., 2017. Hoo are you? Tits do not respond to novel predators as threats. Anim. Behav. 128, 79–84.
Caro, T.M., 2005. Antipredator Defenses in Birds and Mammals. University of Chicago Press, Chicago, IL.
Chappell, M.A., Bachman, G.C., 2002. Energetic costs of begging behaviour. In: Wright, J., Leonard, M.L. (Eds.), The Evolution of Begging: Competition, Cooperation and Communication. Kluwer Academic, Dordrecht, pp. 143–162.
Chivers, D.P., Ferrari, M.C.O., 2013. Tadpole antipredator responses change over time: what is the role of learning and generalization? Behav. Ecol. 24, 1114–1121.
Congdon, J.V., Hahn, A.H., Campbell, K.A., Scully, E.N., Yip, D.A., Bayne, E.M., et al., 2020. Acoustic discrimination of predators by black-capped chickadees (Poecile atricapillus). Anim. Cogn. 23, 595–611.
Dessborn, L., Englund, G., Elmberg, J., Arzél, C., 2012. Innate responses of mallard ducklings towards aerial, aquatic and terrestrial predators. Behaviour 149, 1299–1317.
Fallow, P.M., Pitcher, B.J., Magrath, R.D., 2013. Alarming features: birds use specific acoustic properties to identify heterospecific alarm calls. Proc. R. Soc. B 280, 20122539.
Fluck, E., Hogg, S., Mabbutt, P.S., File, S.E., 1996. Behavioural and neurochemical responses of male and female chicks to cat odour. Pharmacol. Biochem. Behav. 54, 85–91.
Fuchs, R., Veselý, P., Nácarová, J., 2019. Predator Recognition in Birds: the Use of Key Features. Springer, Cham.
Ghalambor, C., Martin, T., 2001. Fecundity-survival trade-offs and parental risk-taking in birds. Science 292, 494–497.
Gill, S.A., Neudorf, D.L., Sealy, S.G., 1997. Host responses to cowbirds near the nest: cues for recognition. Anim. Behav. 53, 1287–1293.
Göth, A., 2001. Innate predator-recognition in Australian brush-turkey (Alectura lathami, Megapodiidae) hatchlings. Behaviour 138, 117–136.
Griffin, A.S., 2009. Temporal limitations on social learning of novel predators by Indian mynahs, Acridotheres tristis. Ethology 115, 287–295.
Haff, T.M., Magrath, R.D., 2010. Vulnerable but not helpless: nestlings are fine-tuned to cues of approaching danger. Anim. Behav. 79, 487–496.
Haff, T.M., Magrath, R.D., 2011. Calling at a cost: elevated nestling calling attracts predators to active nests. Biol. Lett. 7, 493–495.
Haskell, D., 1994. Experimental evidence that nestling begging behaviour incurs a cost due to nest predation. Proc. R. Soc. B 257, 161–164.
He, S., Lin, M., Shi, L., Chen, D., 2022. Occurrence, distribution, and ecological risk assessment of contaminants in Baiyangdian Lake. China. Water 14, 3352.
Hua, F., Sieving, K., Fletcher, R., Wright, C., 2014. Increased perception of predation risk to adults and offspring alters avian reproductive strategy and performance. Behav. Ecol. 25, 509–519.
Ibáñez-Álamo, J.D., Magrath, R.D., Oteyza, J.C., Chalfoun, A.D., Haff, T.M., Schmidt, K.A., et al., 2015. Nest predation research: recent findings and future perspectives. J. Ornithol. 156, 247–262.
Khayutin, S.N., 1985. Sensory factors in the behavioral ontogeny of altricial birds. Adv. Stud. Behav. 15, 105–152.
Kullberg, C., Lind, J., 2002. An experimental study of predator recognition in great tit fledglings. Ethology 108, 429–441.
Leonard, M.L., Horn, A.G., Mukhida, A., 2005. False alarms and begging in nestling birds. Anim. Behav. 69, 701–708.
Madden, J.R., Kilner, R.M., Davies, N.B., 2005a. Nestling responses to adult food and alarm calls: 1. Species-specific responses in two cowbird hosts. Anim. Behav. 70, 619–627.
Madden, J.R., Kilner, R.M., Davies, N.B., 2005b. Nestling responses to adult food and alarm calls: 2. Cowbirds and red-winged blackbirds reared by eastern phoebe hosts. Anim. Behav. 70, 629–637.
Magrath, R.D., Pitcher, B.J., Dalziell, A.H., 2007. How to be fed but not eaten: nestling responses to parental food calls and the sound of a predator’s footsteps. Anim. Behav. 74, 1117–1129.
Maloney, R.F., Mclean, I.G., 1995. Historical and experimental learned predator recognition in free-living New Zealand robins. Anim. Behav. 50, 1193–1201.
McLean, I.G., Hölzer, C., Studholme, B.J., 1999. Teaching predator-recognition to a naive bird: implications for management. Biol. Conserv. 87, 123–130.
Rainey, H.J., Zuberbühler, K., Slater, P.J.B., 2004. Hornbills can distinguish between primate alarm calls. Proc. R. Soc. B 271, 755–759.
Schaller, G.B., Emlen, J.T., 1961. The development of visual discrimination patters in the crouching reactions of nestling grackles. Auk 78, 125–137.
Schneider, N.A., Griesser, M., 2014. Within-season increase in parental investment in a long-lived bird species: investment shifts to maximize successful reproduction? J. Evol. Biol. 28, 512–520.
Shang, Y., 2018. Behavioral Ecology, second ed. Peking University Press, Beijing.
Sih, A., Englund, G., Wooster, D., 1998. Emergent impacts of multiple predators on prey. Trends Ecol. Evol. 13, 350–355.
Slabbekoorn, H., Smith, T.B., 2002. Bird song, ecology and speciation. Philos. Trans. Roy. Soc. B 357, 493–503.
Steindler, L.A., Blumstein, D.T., West, R., Moseby, K.E., Letnic, M., 2020. Exposure to a novel predator induces visual predator recognition by naïve prey. Behav. Ecol. Sociobiol. 74, 102.
Suzuki, T.N., 2011. Parental alarm calls warn nestlings about different predatory threats. Curr. Biol. 21, R15–R16.
Trnka, A., Trnka, M., Grim, T., 2015. Do rufous common cuckoo females indeed mimic a predator? An experimental test. Biol. J. Linn. Soc. 116, 134–143.
Veen, T., Richardson, D.S., Blaakmeer, K., Komdeur, J., 2000. Experimental evidence for innate predator recognition in the Seychelles warbler. Proc. R. Soc. B 267, 2253–2258.
Wang, J., Ma, L., Chen, X., Yang, C., 2022. Common cuckoo nestling adapts its begging behavior to the alarm signaling system of a host. Front. Ecol. Evol. 10, 830441.
Węgrzyn, E., Leniowski, K., 2015. Blackcap Sylvia atricapilla nestlings do not produce begging calls until they are able to escape from predators. Ibis 157, 356–368.
Whittingham, M.J., Butler, S.J., Quinn, J.L., Cresswell, W., 2004. The effect of limited visibility on vigilance behaviour and speed of predator detection: implications for the conservation of granivorous passerines. Oikos 106, 377–385.
Wright, J., Leonard, M.L., 2002. The Evolution of Begging: Competition, Cooperation and Communication. Springer, Dordrecht.
Yasukawa, K., Sollenberger, J., Lindsey-Robbins, J., DeBruyn, E., 2020. Calling in the face of danger: do nestling Red-winged Blackbirds (Agelaius phoeniceus) suppress begging in response to predator playbacks? Auk 137, ukz071.
Yu, J., Wang, L., Xing, X., Yang, C., Ma, J., Moller, A., et al., 2016. Barn swallows (Hirundo rustica) differentiate between common cuckoo and sparrowhawk in China: alarm calls convey information on threat. Behav. Ecol. Sociobiol. 70, 175–188.
Table
1.
Body size of the core and marginal nestlings at the two study sites (mean ± SD).
Age
Nestling status
Study site
Body mass (g)
Body length (mm)
Tail length (mm)
Wing length (mm)
Tarsus length (mm)
Toe length (mm)
Beak length (mm)
1-day-old
Core
Polluted
2.89 ± 0.77
35.93 ± 2.25**
0.92 ± 0.30**
6.53 ± 0.57
6.41 ± 0.66
4.29 ± 0.42
3.43 ± 0.43*
Unpolluted
3.04 ± 0.54
37.96 ± 2.16
1.66 ± 0.49
6.56 ± 0.56
6.37 ± 0.43
4.50 ± 0.52
3.66 ± 0.39
Marginal
Polluted
2.61 ± 0.73
35.42 ± 2.30*
1.03 ± 0.42
6.39 ± 0.73
6.36 ± 0.62
4.32 ± 0.57
3.46 ± 0.39
Unpolluted
2.68 ± 0.61aa
36.84 ± 2.65a
1.31 ± 0.51
6.32 ± 0.73
6.10 ± 0.65a
4.31 ± 0.58
3.51 ± 0.39
5-day-old
Core
Polluted
10.41 ± 1.77**
54.96 ± 4.25**
2.92 ± 1.10**
13.99 ± 2.32**
12.35 ± 1.26**
8.74 ± 1.17**
5.64 ± 0.81
Unpolluted
11.74 ± 1.83
57.35 ± 4.19
3.50 ± 1.05
15.49 ± 2.80
12.99 ± 1.36
9.73 ± 1.25
5.60 ± 0.62
Marginal
Polluted
9.08 ± 2.71aa
53.21 ± 4.47a
2.74 ± 1.20
13.17 ± 2.51*a
11.95 ± 1.64
8.47 ± 1.35*
5.79 ± 0.87**
Unpolluted
9.34 ± 2.33aa
53.90 ± 5.39aa
2.96 ± 1.19a
14.38 ± 3.05a
12.11 ± 1.43aa
9.28 ± 1.65
5.32 ± 0.44a
10-day-old
Core
Polluted
17.16 ± 2.14**
81.86 ± 6.67**
17.34 ± 3.89**
36.89 ± 4.78**
36.96 ± 3.91**
11.58 ± 0.68**
7.04 ± 0.62*
Unpolluted
19.01 ± 2.33
85.32 ± 5.66
19.43 ± 3.92
39.32 ± 4.42
17.50 ± 0.64
12.08 ± 1.03
7.23 ± 0.58
Marginal
Polluted
15.63 ± 3.17*aa
77.75 ± 8.26*aa
15.04 ± 4.32aa
34.34 ± 5.97aa
16.60 ± 1.17*a
11.30 ± 0.82**a
6.86 ± 0.68
Unpolluted
17.05 ± 2.93aa
81.07 ± 6.27aa
16.57 ± 4.39aa
36.24 ± 6.31aa
17.12 ± 1.04a
12.02 ± 1.13
7.08 ± 0.60
Growth rate
Core
Polluted
0.55 ± 0.21
0.19 ± 0.12*
0.48 ± 0.14
0.34 ± 0.10
0.44 ± 0.11
0.52 ± 0.17
0.30 ± 0.15
Unpolluted
0.55 ± 0.14
0.16 ± 0.05
0.48 ± 0.11
0.34 ± 0.06
0.43 ± 0.13
0.51 ± 0.16
0.27 ± 0.12
Marginal
Polluted
0.54 ± 0.26
0.20 ± 0.08*
0.44 ± 0.14
0.33 ± 0.06
0.42 ± 0.19
0.45 ± 0.16
0.29 ± 0.20
Unpolluted
0.48 ± 0.10a
0.16 ± 0.05
0.45 ± 0.10
0.32 ± 0.05a
0.39 ± 0.11
0.50 ± 0.16
0.25 ± 0.07
*: P < 0.05 compared to unpolluted site population; **: P < 0.01 compared to unpolluted site population. a: P < 0.05 compared to core nestling in the same population; aa: P < 0.01 compared to core nestling in the same population.
Table
2.
Multiple regression analysis of the relationship between nestling size (PC1) of the 1-, 5-, and 10-day-old core nestlings and developmental and phenotypic variables.
Study site
Independent variable
Day 1
Day 5
Day 10
β
SE
P
β
SE
P
β
SE
P
Polluted
Constant
−5.265
5.388
0.432
3.625
4.612
0.448
−0.276
4.639
0.954
Hatch date
0.160
0.594
0.813
−0.074
0.529
0.891
−0.056
0.546
0.920
Clutch size
−0.791
1.044
0.528
0.628
0.647
0.352
0.584
0.626
0.371
Mean mass of core eggs(g)
2.465
5.032
0.673
−1.929
1.578
0.247
−0.227
1.551
0.886
Mean spotting coverage ratio of core eggs (%)
−3.936
3.411
0.368
−0.040
2.275
0.986
1.986
1.989
0.339
Core brood size at hatching
1.513
1.526
0.426
−0.563
0.715
0.447
−0.502
0.648
0.455
Marginal brood size at hatching
1.041
1.260
0.496
−0.377
0.543
0.502
−0.759
0.516
0.170
Unpolluted
Constant
−8.541
3.044
0.038
−14.763
3.749
0.003
−1.787
3.921
0.655
Hatch date
−0.339
0.764
0.676
0.184
0.505
0.723
−0.841
0.558
0.152
Clutch size
0.147
0.452
0.758
0.777
0.345
0.048
0.417
0.384
0.295
Mean mass of core eggs (g)
4.504
1.206
0.014
5.056
1.422
0.005
2.303
1.432
0.129
Mean spotting coverage ratio of core eggs (%)
2.093
2.077
0.360
1.169
2.410
0.638
1.453
2.644
0.591
Core brood size at hatching
−0.531
0.312
0.149
−0.773
0.319
0.036
−0.398
0.332
0.249
Marginal brood size at hatching
−0.054
0.252
0.837
−0.288
0.246
0.269
−0.227
0.288
0.443
β, the SE of β and the P value of a Student’s t-test of β are shown. Overall significance of the regression: polluted site: day 1, F = 1.389, P = 0.476, R2 = 0.650; day 5, F = 0.403, P = 0.862, R2 = 0.180; day 10, F = 0.502, P = 0.795, R2 = 0.215; unpolluted site: day 1, F = 3.381, P = 0.101, R2 = 0.802; day 5, F = 3.724, P = 0.033, R2 = 0.691; day 10, F = 1.052, P = 0.432, R2 = 0.296.
Table
3.
Multiple regression analysis of the relationship between nestling size (PC1) of the 1-, 5-, and 10-day-old marginal nestlings and developmental and phenotypic variables.
Study site
Independent variable
Day 1
Day 5
Day 10
β
SE
P
β
SE
P
β
SE
P
Polluted
Constant
1.852
4.279
0.707
−2.773
5.073
0.598
−10.023
5.207
0.090
Hatch date
−0.004
0.503
0.995
0.121
0.614
0.848
0.903
0.631
0.190
Clutch size
0.484
0.642
0.530
0.309
0.802
0.709
0.126
0.802
0.879
Mean mass of marginal eggs (g)
−4.047
2.243
0.213
0.421
2.139
0.848
2.931
2.664
0.303
Mean spotting coverage ratio of marginal eggs (%)
−1.954
4.277
0.693
0.572
2.307
0.810
0.600
3.167
0.854
Core brood size at hatching
1.423
1.162
0.345
−0.320
0.699
0.658
−0.760
0.910
0.428
Marginal brood size at hatching
1.341
0.711
0.200
0.074
0.536
0.893
−0.457
0.546
0.427
Unpolluted
Constant
−5.302
4.995
0.329
−9.215
9.449
0.385
−4.167
2.012
0.077
Hatch date
0.212
0.931
0.828
−0.182
1.916
0.929
−0.040
0.237
0.872
Clutch size
−0.579
0.527
0.314
−0.601
0.871
0.528
−0.319
0.184
0.127
Mean mass of marginal eggs (g)
2.455
1.443
0.140
4.739
3.276
0.222
2.483
0.619
0.005
Mean spotting coverage ratio of marginal eggs (%)
−0.605
2.665
0.828
−0.306
4.941
0.954
−0.477
1.039
0.660
Core brood size at hatching
0.135
0.332
0.699
0.286
0.847
0.753
−0.221
0.134
0.145
Marginal brood size at hatching
0.857
0.471
0.119
1.215
1.253
0.387
0.863
0.183
0.002
β, the SE of β and the P value of a Student’s t-test of β are shown. Overall significance of the regression: polluted site: day 1, F = 1.704, P = 0.415, R2 = 0.836; day 5, F = 0.487, P = 0.803, R2 = 0.245; day 10, F = 1.079, P = 0.447, R2 = 0.447; unpolluted site: day 1, F = 0.999, P = 0.501, R2 = 0.500; day 5, F = 0.562, P = 0.749, R2 = 0.457; day 10, F = 9.324, P = 0.005, R2 = 0.889.

 DownLoad:


 Email Alerts
 RSS Feeds