Abundance of insects and aerial insectivorous birds in relation to pesticide and fertilizer use
-
Abstract:Background
The abundance of insects has decreased considerably during recent decades, resulting in current abundance showing 70–80% reductions in more than 15 studies across temperate climate zones. Dramatic reductions in the abundance of insects are likely to have consequences for other taxa at higher trophic levels such as predators and parasites. Pesticides, fertilizers and agricultural land use are likely candidates accounting for such reductions in the abundance of insects.
MethodsHere we surveyed the abundance of flying insects, and the reduction in the abundance of insects as a consequence of intensive reduction in agricultural practice linked to fertilizer use and pesticide use. Finally we demonstrated consistency in abundance of birds among study sites.
ResultsWe demonstrated that the use of fertilizers and pesticides had reduced the abundance of insects, with consequences for the abundance of insectivorous bird species such as Barn Swallows (Hirundo rustica), House Martins (Delichon urbicum) and Swifts (Apus apus). Juvenile Barn Swallows were negatively affected by the reduced abundance of insects and hence the reproductive success of insectivorous bird species. These effects imply that the abundance of insects could be reduced by the availability of insect food.
ConclusionsThese effects of intensive agriculture on insect food abundance are likely to have negative impacts on populations of insects and their avian predators. This hypothesis was validated by a reduction in the abundance of insects, linked to an increase in the abundance of fertilizers and a general change in farming practice.
-
Keywords:
- Aerial insectivores /
- Fecundity of insects /
- Insect abundance /
- Insectivores /
- Insects
-
Background
The Common Pheasant (Phasianus colchicus) Linnaeus, 1758 is the most widespread pheasant in the world with a natural, geographic range spanning in temperate to subtropical regions of the Palearctic realm (Johnsgard 1999). This species exhibits a high-level of intra-specific differentiation in plumage coloration and patterns in males. Thirty subspecies forming five subspecies groups were defined mainly based on geographically distributed affinities and morphological characters (Cramp and Simmons 1980; Johnsgard 1999; Madge and McGowan 2002). The five subspecies groups are as follows: (1) the colchicus group (Black-necked Pheasants, west and south of the Caspian Sea, including the subspecies persicus, talischensis, colchicus and septentrionalis); (2) the principalis-chrysomelas group (White-winged Pheasants in Central Asia, including the subspecies principalis, zarudnyi, chrysomelas, bianchii, zerafschanicus and shawii); (3) the tarimensis group (Tarim Pheasant, tarimensis in Tarim Basin in southeastern Xinjiang, China); (4) the mongolicus group (Kirghiz Pheasants in northern Xinjiang, China and eastern Kazakhstan, comprising mongolicus and turcestanicus) and (5) the most subspecies-rich group, the torquatus group (Grey-rumped Pheasants, mostly found in China, containing 17 subspecies: decollatus, satscheuensis, pallasi, suehschanensis, torquatus, kiangsuensis, rothschildi, karpowi, strauchi, elegans, vlangalii, hagenbecki, edzinensis, alaschanicus, sohokhotensis, takatsukasae and formosanus) (Madge and McGowan 2002).
The Common Pheasant has a long history of captivity and being introduced as a common game species in western Europe, North America and Australia (Hill and Robertson 1988; Johnsgard 1999). This species deserves conservation management and sustainable use for several reasons. First of all, because natural populations of the Common Pheasant have been dramatically declining due to the loss of its natural habitats, hunting and other anthropogenic disturbances (Sotherton 1998), restocking of this bird is increasingly needed. For example, native habitat loss due to reclamation for agriculture caused a population decline in the subspecies principalis and persiscus in Iran (Solokha 1994). The subspecies turcestanicus is probably extinct now as a result of the aridification of the Aral Sea (Lepage 2007). As well, hybridized decendents between local subspecies and ex situ subspecies, due to artificial introduction of captive birds for hunting purposes, are evident in the wild (Braasch et al. 2011). Even worse is likely to occur, in so far as Common Pheasants in the wild may interbreed with a commercial, captive breed, the so-called "seven-color wild pheasant" which is a hybridized race between the Common Pheasant and its sister species, endemic to the Japan archipelagos, the Green Pheasant (Phasianus versicolor). For all these reasons genetic pollution in the wild Common Pheasant gene pool may occur. Last but not least, some range-restricted subspecies of the Common Pheasants inhabit isolated range and extreme environments such as arid regions, islands and mountains which preserve unique phenotypes and genotypes for future conservation and stocking (Braasch et al. 2011; Kayvanfar et al. 2017). For example, the formosanus subspecies of the Common Pheasant is endemic to Taiwan; other subspecies hagenbecki, alaschanicus and tarimensis are isolated and have adapted to semi-desert conditions (Johnsgard 1999). These conservation and management issues require evaluation using conservation approaches in genetics. Developing permanent genetic resources, such as autosomal microsatellites are of critical importance.
Microsatellites, also known as simple sequence repeats (SSRs), are a preferred type of markers in conservation genetics (Sunnucks 2000). Because of their heritable mode, SSRs usually have a higher mutation rate than that of mitochondrial and nuclear intronic markers and represent a very useful tool to genotype individuals and thus allow the quantifications of intraspecific genetic diversity, population structure and gene flow (Selkoe and Toonen 2006). Applications of SSRs are also reliable because of their relatively great abundance in genomes, high level of genetic polymorphism, co-dominant inheritance mode, analytical simplicity and repeatability of results across laboratories. So far, no species-specific microsatellites are available for the Common Pheasant although a previous study showed that cross-amplification of a very limited number of SSRs from other closely related Phasianinae species should be applicable for Common Pheasants (Baratti et al. 2001).
Recent advances in next generation sequencing (NGS) technologies enable the generation of large number of sequences efficiently and cost-effectively (reviewed in Ekblom and Galindo 2011). In addition, the so-called "Restriction-site Associated DNA" (RAD) method was consequently developed as a reliable means for genome complexity reduction (Baird et al. 2008). The concept is based on acquiring the sequence adjacent to a set of particular restriction enzyme recognition sites and then obtain sequences (RAD-seq) by NGS technology. Application of the RAD method, using the Illumina platform, has the advantage that it generates relatively long paired-end sequencing reads (100-150 bp), is cost-effective and sufficient to develop SSRs (Castoe et al. 2012). Another advantage is that a RAD-seq does not require a reference genome to be available and allows de novo assembly (Willing et al. 2011).
In this study we developed a set of autosomal microsatellites for the Common Pheasant using RAD-seq. We further designed multiplex PCR sets and tested for genetic polymorphism in a selected panel of 10 selected SSRs, which provide a tool for conservation genetic and studies of the evolution in the Common Pheasant.
Methods
To conduct RAD sequencing, we collected fresh tissues and blood samples from 60 individuals comprising seven subspecies in China (strauchi, vlangalii, kiangsuensis, karpowi, torquatus, elegans and tarimensis). Sample size for each subspecies varied between four to ten individual birds. Total genomic DNA was extracted using a QIAquick DNeasy kit (Qiagen, Hilden, Germany) following the manufacturer's instructions.
Genomic DNA was digested with a restriction enzyme, ApeKI. Adapters P1 and P2 were ligated to the fragments. The P1 adapter contains a forward amplification primer site, an Illumina sequencing primer site and a barcode. Selected fragments were then subjected to end-repair and 3ʹ adenylated. The fragments are PCR amplified with P1- and P2-specific primers. Library was validating on the Agilent Technologies 2100 Bio-analyzer and the ABI StepOnePlus Real-Time PCR System. After adapter ligation and DNA cluster preparation, the samples were subjected to sequencing by a Hiseq 2000 sequencer (BGI, Shenzhen, China).
The raw data of 60 individuals have been processed by deleting adapter sequences and subsequently removing the reads, of which the rate of low quality (quality value ≤5 E) is more than or equal to 50%. All reads were then assigned to the individuals by the ambiguous barcodes and the specific recognition site (GWCC). Reads without a unique barcode and specific sequence were discarded. Final read length was trimmed to 82 nucleotides (minimum length). Then, the first four samples with high sequencing quality were selected to assemble the reference scaffolds. The assembly was performed using SOAPdenovo (Li et al. 2010), with scaffolds larger than 150 bp retained.
The collected polymorphic information of raw data from the 60 individuals was used to identify microsatellites by screening the sequence data for di-, tri-, tetra- and penta-nucleotide motifs with a minimum of ten repeats each. We applied MSATCOMMANDER 1.0.8 (Faircloth 2008) interfaces with the PRIMER3 software (http://bioinfo.ut.ee/primer3/), to allow the design of primers while minimizing potential structural or functional defects. The MSATCOMMANDER program was modified to ensure that the flanking region between the microsatellite and primer sequence would generate an amplicon size in the range of 100-250 bp, inclusive of the lengths of both primers (Brandt et al. 2014). After these procedures we randomly selected a panel of 30 novel di-nucleotide markers, together with five microsatellite markers isolated from the chicken genome (Baratti et al. 2001). We designed SSR primers using the online program Primer 3 (http://sourceforge.net/projects/primer3).
We continued to verify genetic polymorphism of the developed candidate microsatellites, by using another sample set, comprising 90 individuals from nine subspecies in China (vlangalii, satscheuensis, strauchi, elegans, decollatus, torquatus, kiangsuensis, karpowi and pallasi). We also included captive individuals of the Green Pheasant, a sister species of the Common Pheasant distributed in the Japanese archipelago. Sample size for each subspecies/species was restricted to ten individuals, allowing for unbiased comparisons of genetic polymorphism. Overall, we included 100 individuals for further analyses. Total genomic DNA was extracted using the same protocol with the samples for RAD-seq.
We checked their polymorphism on 2.5% agarose gels. In the end, ten novel and three extant markers with polymorphic signals were retained (Table 1). The selected 13 loci were further arranged into three PCR multiplex sets (Table 2) and each forward primer was labeled with a fluorescent dye. Each amplification was carried out in a 10-µL reaction volume containing 5 µL of PCR mix (QIAGEN Multiplex Kit), 1 µL of a primer mix and 1 µL of template DNA. The PCR conditions were as follows: initial denaturation at 95 ℃ for 5 min, followed by 35 cycles of denaturation at 94 ℃ for 30 s, annealing at 58 ℃ for 45 s and at 72 ℃ for 90 s and a final extension at 72 ℃ for 10 min. Products were isolated and detected on an ABI Prism 3730XL Genetic Analyzer (Applied Biosystems, service provided by Invitrogen, Shanghai, China). Fragment lengths were checked in comparison to an internal standard size (GeneScanTM-600LIZ, Applied Biosystems), using GeneMarker software v.2.2 (Soft Genetic).
Table 1. Characteristics of 13 microsatellites in a sample set of 90 individuals of the Common Pheasant (Phasianus colchicus)Locus Primer sequence Repeat motif Annealing temperature (℃) Size range (bp) NA HO HE PIC PC 1 F: AGCACATCACAGTGCTTTGAGC (AT)5 58 201-205 4.2 0.440 0.680 0.635 R: TTTGCTCAGGAAAAGAAAATAAAGACA PC 2 F: AAAAAGCTCATTTGCTGTGGAA (AT)10 56 227-240 3.4 0.460 0.707 0.672 R: TCTTTGTCTTCACCCTCATGGA PC 3 F: GAGGGTAGAGAGAAACAGGTGTTGA (CA)7 57 152-167 7.6 0.620 0.886 0.871 R: GAGGTAATCTCTCACTGCTGATTGG PC 4 F: TTCCAAAAGCATATCCCAGAGC (AC)7 58 87-94 1.6 0.110 0.274 0.254 R: TAAGATAGCCCATCCTTTGGGG PC 5 F: TGACCACTACAGTTTCCCATTCTTC (CT)8 57 284-286 4.4 0.540 0.801 0.777 R: AGATCTTCAGTAGCTCTTGGAACACA PC 6 F: ACGGTCAGTAAGCATGTACCCC (TG)10 57 84-101 6 0.500 0.763 0.701 R: AGCAGTCAATGGAGAGCAGGTT PC 7 F: GGCTGTCCTTTTAGCTACAGCAG (AT)13 57 89-93 7.8 0.830 0.905 0.893 R: CATCATCAAGAAGCATTGCAAAA PC 8 F: GACCTCTGTCATTGGTTTTGGA (TG)14 56 180-202 1.3 0.030 0.049 0.048 R: TATGATTGTGAACAGCTGCCAA PC 9 F: AATGGGAACTTTTTCAGGGACAA (AC)14 58 237-270 2.8 0.310 0.559 0.504 R: TTTGAAGTTGGTGGGACTCCAT PC 10 F: GCTGCAAATCTCCTTAGCTCCA (TG)16 58 207-242 11 0.579 0.905 0.869 R: GGAGCAACAGTGGGAGAAGAAA MCW 97 F: GGAGAGCATCTGCCTTCCTAG (AT)8C(AT)6C(AT)10C 50 266-292 2.1 0.980 0.512 0.389 R: TGGTCTTCCAGTCTATGGTAG MCW 127 F: TGCAATAAGAGAAGGTAAGGTC (TA)7 50 209-240 2.0 0.290 0.478 0.397 R: GAGTTCAGCAGGAATGGGATG MCW 151 F: CATGCTGTGATACTACAATTCC (CA)8 50 251-269 2.8 0.370 0.618 0.588 R: AACATCCTGGAGTTTGGGAAG The number of alleles (NA), observed (HO) and the expected heterozygosities (HE), as well as the polymorphism information content (PIC) were estimated for each locus Table 2. Characteristics of three multiplex sets used in genotyping of the Common Pheasant (Phasianus colchicus)Multiplex sex Locus Fluorescent dye Allele range (bp) Annealing temperature (℃) 1 PC4 FAM 87-94 56 PC8 ROX 180-202 PC1 FAM 201-205 PC10 HEX 207-241 PC9 FAM 237-270 2 PC6 FAM 84-101 57 PC7 ROX 89-93 PC3 FAM 152-167 PC2 FAM 227-240 PC5 FAM 284-286 3 MCW 127 ROX 209-240 52 MCW 151 HEX 251-269 MCW 97 FAM 266-292 For each microsatellite locus, we calculated the number of alleles (NA), observed (HO) and the expected heterozygosities (HE), as well as the polymorphism information content (PIC) with CERVUS v.3 (Kalinowski et al. 2007). Deviations from the Hardy-Weinberg equilibrium (HWE) and genotypic equilibrium between loci were tested with the same program. Significance levels were adjusted for multiple testing using the Bonferroni procedure (Rice 1989) if necessary.
In order to explore the detectability of population structures by the novel microsatellite set, we further identified the number of genetic clusters (K) among the 90 common and 10 Green Pheasants, using the Bayesian admixture model with the correlated allele frequencies option implemented in STRUCTURE v.2.3.4 (Pritchard et al. 2000; Falush et al. 2003). We performed one million Markov chain Monte Carlo (MCMC) repetitions and a burn-in of 200, 000 repetitions with ten independent runs each for K = 1-7. The most likely number of genetic clusters was determined on the basis of the ad hoc statistics described in Evanno et al. (2005) using the STRUCTURE Harvester v.0.6.8 (Earl 2011).
Results
About 127.98 G bases of raw data were generated for all the pooling lanes. After the raw data had been processed, about 123.27 G bases of clean data were retained. Then all reads with ambiguous barcodes were trimmed and about 114.91 G bases of clean data were kept for downstream analysis. The assembly generated 744, 632 scaffolds larger than 150 bp, with a total length of 157 Mb. The average length was 211 bp with the largest of 1225 bp. The N50 statistic of the assembly was 254 bp. The microsatellite detection generated 7598 markers with 6419 di-nucleotide repeats, 766 tri-nucleotide repeats, 352 tetra-nucleotide repeats and 61 penta-nucleotide repeats (Additional file 1: Table S1). These data were further used for analysis of the population genome.
We detected significant departures from HWE at all loci, which is expected due to population structuring among individuals (Table 1). In addition, there was no evidence of genotypic disequilibrium after the Bonferroni correction. The number of alleles ranged from 2 to 8. The HO values ranged from 0.03 to 0.98 and those of HE from 0.049 to 0.905. The polymorphic information content (PIC) ranged between 0.048-0.893, with seven out of eleven loci having a PIC value around or above 0.50. In addition, we successfully amplified all 13 microsatellites with our 10 Green Pheasant samples. However, only six (PC6, PC8, PC9, MCW 97, MCW127 and MCW151) out of 13 loci showed polymorphism in the Green Pheasants.
The Bayesian clustering approach implemented in STRUCTURE suggested two genetic clusters (Fig. 1) as the most likely scenario based on the Evanno's method. The means of the posterior probability, Ln P (D) (±SD) for different number of genetic groups (K), increased between K = 1-7 (Fig. 1b). The ∆K statistic reached a peak when K = 2 (Fig. 1c), suggesting that the result of two genetic clusters was the most likely scenario. This corresponds to the subdivision between the common and green pheasants. However, we also obtained a smaller peak when K = 5 (Fig. 1c) which most likely reflects a further population subdivision within Common Pheasants. We plotted the assignment of genetic clusters when K = 2-7 and found that the subspecies elegans, vlangalii and satscheuensis represented distinctive genetic clusters in contrast with the remaining subspecies (Fig. 1a).
![Figure 1. a Population structuring of Common and Green Pheasants inferred from STRUCTURE that used admixture model with correlated allele frequencies when K = 1-7. Each line represents an individual and the length of each color represents the possibility of the individual assigned into a given genetic cluster. The abbreviation stands for subspecies of Common Pheasant (VLA: vlangalii, SAT: satscheuensis, STR: strauchi, ELE: elegans, DEC: decollatus, TOR: torquatus, KIA: kiangsuensis, KAR: karpowi, PAL: pallasi, PV: Green Pheasant). b Although the means of the posterior probability Ln P (D) (±SD) increased per K, c two genetic clusters were suggested by the maximum value of ΔK and the order rate of change in posterior likelihood Ln P (X/K) per K]() Figure 1. a Population structuring of Common and Green Pheasants inferred from STRUCTURE that used admixture model with correlated allele frequencies when K = 1-7. Each line represents an individual and the length of each color represents the possibility of the individual assigned into a given genetic cluster. The abbreviation stands for subspecies of Common Pheasant (VLA: vlangalii, SAT: satscheuensis, STR: strauchi, ELE: elegans, DEC: decollatus, TOR: torquatus, KIA: kiangsuensis, KAR: karpowi, PAL: pallasi, PV: Green Pheasant). b Although the means of the posterior probability Ln P (D) (±SD) increased per K, c two genetic clusters were suggested by the maximum value of ΔK and the order rate of change in posterior likelihood Ln P (X/K) per K
Figure 1. a Population structuring of Common and Green Pheasants inferred from STRUCTURE that used admixture model with correlated allele frequencies when K = 1-7. Each line represents an individual and the length of each color represents the possibility of the individual assigned into a given genetic cluster. The abbreviation stands for subspecies of Common Pheasant (VLA: vlangalii, SAT: satscheuensis, STR: strauchi, ELE: elegans, DEC: decollatus, TOR: torquatus, KIA: kiangsuensis, KAR: karpowi, PAL: pallasi, PV: Green Pheasant). b Although the means of the posterior probability Ln P (D) (±SD) increased per K, c two genetic clusters were suggested by the maximum value of ΔK and the order rate of change in posterior likelihood Ln P (X/K) per KDiscussion
Microsatellites are commonly used genetic markers in evolutionary, behavioral and conservation genetics due to their relatively high level of polymorphism and repeatability in genotyping. In a given species, microsatellite markers can be isolated and developed from scratch using methods such as magnetic beads (e.g. Wang et al. 2009) or by applying cross-species amplification using existing markers from closely related species (e.g. Dawson et al. 2010; Gu et al. 2012). The recent fast development of NGS has drastically promoted discoveries of novel microsatellites by using more cost-effective and less time-consuming strategies. Unlike laboratory-biased traditional methods, these approaches provide a massive amount of DNA sequencing reads as resources used for microsatellite detection by bioinformatic pipelines. Our results identified ten novel microsatellites in the Common Pheasant using an Illumina paired-end RAD sequencing strategy. Apart from RAD-seq, other sequencing strategies such as RNA-seq (e.g. Wang et al. 2012) and whole genome re-sequencing (e.g. Yang et al. 2015) have been consistently applied depending on the purpose of the research and on a budget.
We designed a panel of 13 multiplexed microsatellite markers that provided considerable polymorphic information to study population genetic structuring in common and green pheasants. In the Common Pheasant, the number of alleles ranged from 2 to 8, which is considered to be medium to high polymorphism (Botstein et al. 1980). However we found that seven loci in the green pheasants were monomorphic, probably owing to low level genetic diversity. The Green Pheasant has a smaller population and restricted range in its geographical distribution, compared to the wide ranging Common Pheasant. Another possibility is that, since only ten captive individuals of the Green Pheasant were included in the analysis, more tests with an enlarged sample set are likely required.
Using these novel microsatellites, we found a major genetic differentiation between the common and green pheasants. These two sister species of the genus Phasianus diverged about 2.8 million years ago based on a mitogenomic study by Li et al. (2015). We found further genetic population subdivisions within nine subspecies of the Common Pheasant in China. While no substantial genetic differentiation within the six subspecies in eastern China (decollatus, torquatus, kiangsuensis, karpowi, pallasi and strauchi), the three subspecies vlangalii, satscheuensis and elegans formed distinctive genetic clusters. These results corroborate the phylogeographic relationships revealed by mtDNA and nuclear intron data in an earlier study (Kayvanfar et al. 2017). In eastern China, subspecies are parapatric and their boundaries genetically vigorous, which is probably due to low genetic divergence and frequent gene flow. When it comes to western China, most subspecies are allopatric and their boundaries are distinct, probably indicating long-term isolation. However these first results are based only on subspecies within the torquatus group (Grey-rumped Pheasants). Samples of subspecies from the western Palearctic are needed to obtain a complete picture of population structuring within the Common Pheasant.
We can conclude that this novel set of microsatellites has proved to be useful for population genetics and conservation implications in the Common Pheasant as well as its sister species the Green Pheasant. As well, this study provides a checklist of 7598 candidate microsatellites (Additional file 1: Table S1) that can be used for genetic linkage mapping in the Common Pheasant and are probably useful to design markers for other closely related and endangered pheasant species (e.g. Chrysolophus, Lophura, Crossoptilon, Syrmaticus) (Gu et al. 2012).
Additional file
Additional file 1: Table S1. Primer sequences, repeat motifs and annealing temperatures for 7598 microsatellite markers developed for the Common Pheasant (Phasianus colchicus).
Authors' contributions
BW, HP, YL designed the experiments. XX, SL, XW performed molecular genetic laboratory works and BW, SL carried out data analysis. BW and YL wrote the manuscript. All authors read and approved the final manuscript.
Acknowledgements
This work was supported by the National Natural Science Foundation of China (No. 31572251) to YL and a grant from the China Postdoctoral Science Foundation (No. 2016M590834) to BW. We thank the following persons who kindly provided samples or assisted with sampling: Edouard Jelen, Zhengwang Zhang, Cheng-Te Yao, Gombobaatar Sundev, Noritaka Ichida, Jong-Ryol Chong and Jun Gou.
Competing interests
The authors declare that they have no competing interests.
Ethical standards
The experiments complied with the current laws of China. All the animal operations were approved by the Institutional Ethical Committee of Animal Experimentation of Sun Yat-sen University and strictly complied with the ethical conditions by the Chinese Animal Welfare Act (20090606).
-
![]()
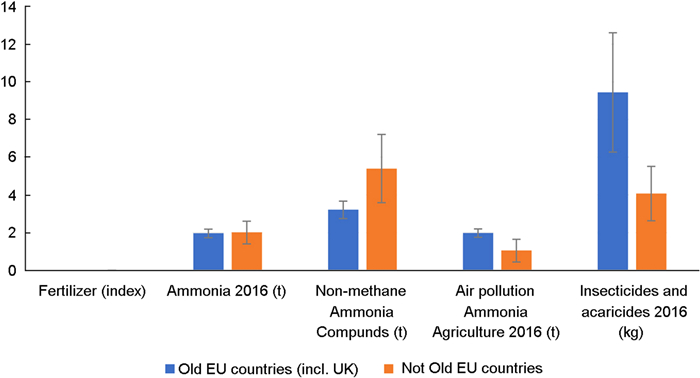
Figure 1. Mean (SE) fertilizer, ammonia, non-methane ammonia compounds, air pollution, ammonia and insecticides and acaricides in Old European Union (EU) countries and in recent (EU) countries. See Methods for sources
![]()
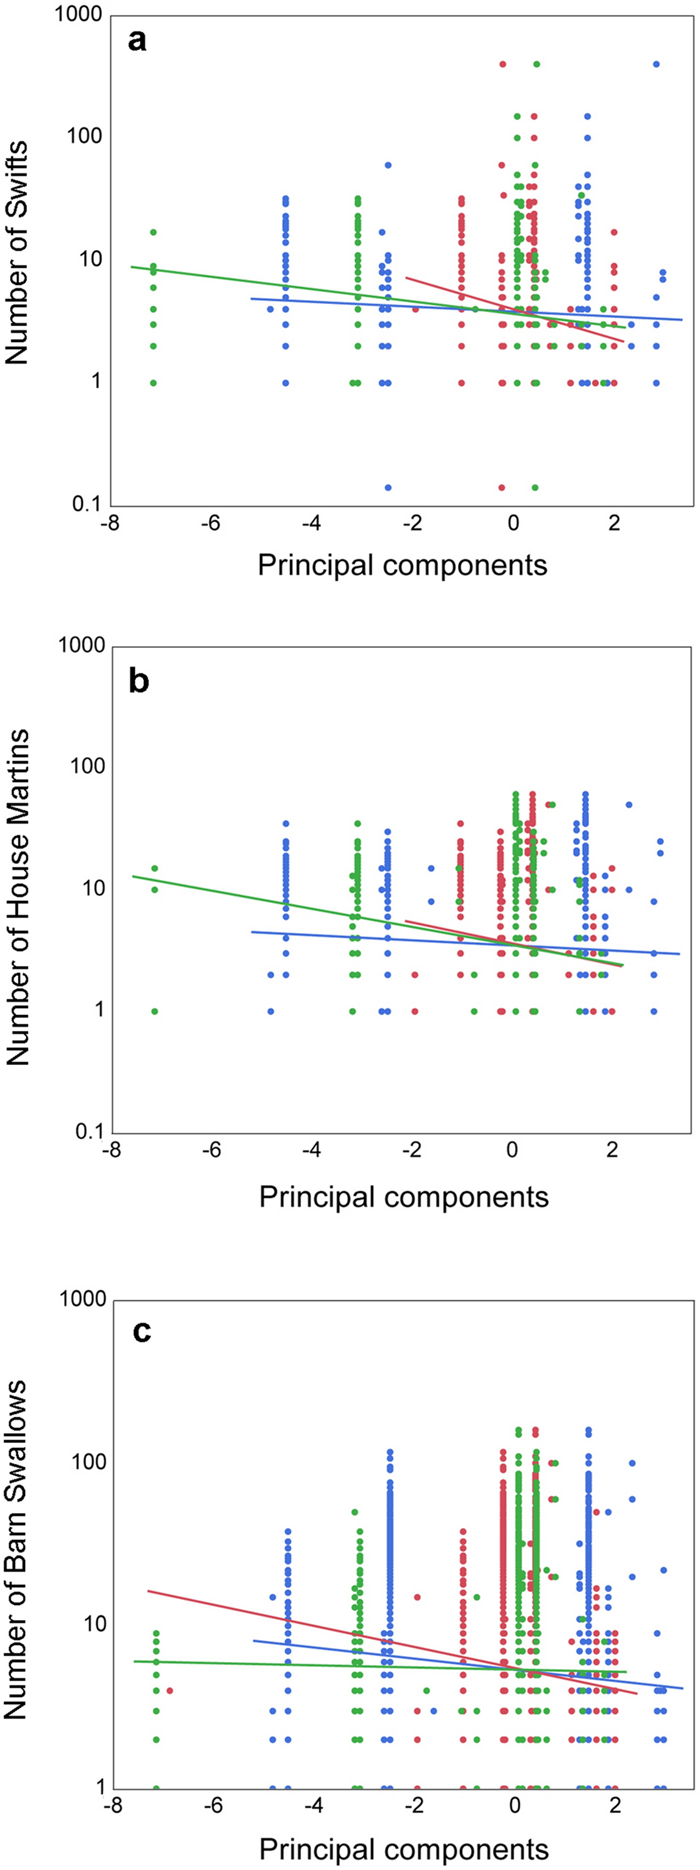
Figure 2. a The number of Swifts during surveys with cars in relation to three principal components with lines representing regression lines and SE. Red, blue and green lines represent PC1, PC2 and PC3. b The number of House Martins during surveys with cars in relation to three principal components with lines representing regression lines and SE. Red, blue and green lines represent PC1, PC2 and PC3. c The number of Barn Swallows during surveys with cars in relation to three principal components with lines representing regression lines and SE. Red, blue and green lines represent PC1, PC2 and PC3
![]()
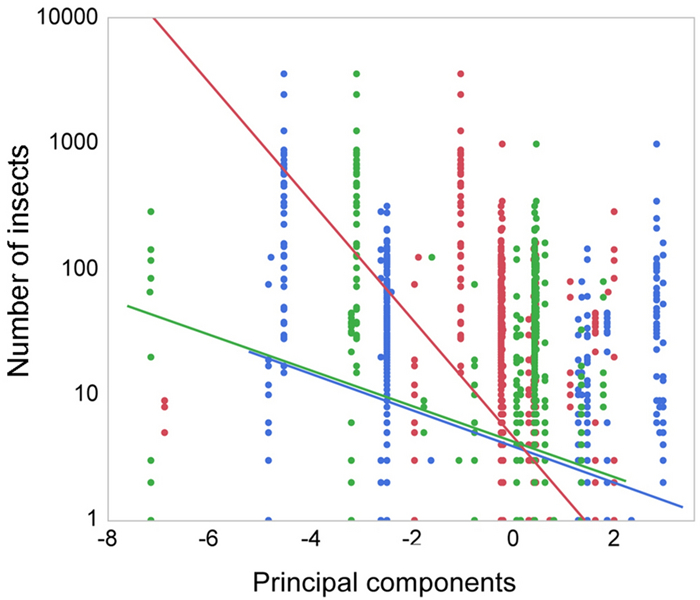
Figure 3. The number of insects making noise during surveys with cars in relation to three principal components with lines representing regression lines and SE. Red, blue and green lines represent PC1, PC2 and PC3
![]()
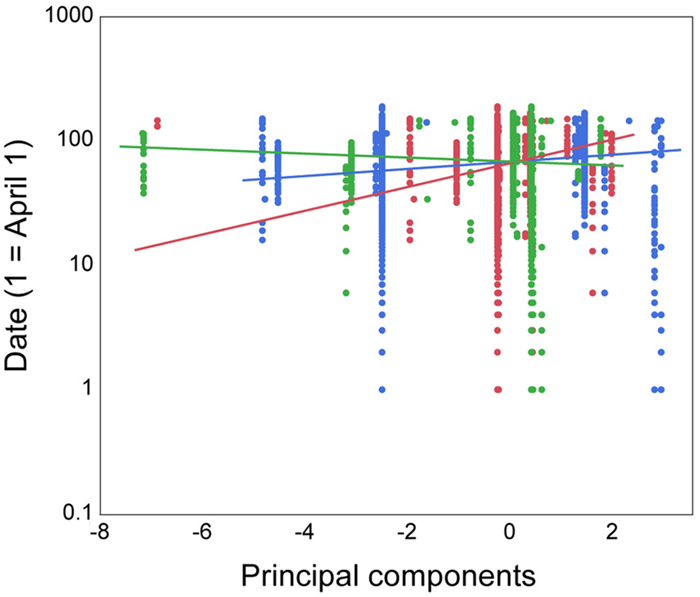
Figure 4. The time when recording insects on the windscreen of cars when date (1 = April 1) is related to three principal components with lines representing regression lines and SE. Red, blue and green lines represent PC1, PC2 and PC3
Table 1 Principal component analysis for agro-chemicals and agricultural practice
Loading matrix PC1 PC2 PC3 PC4 PC5 Fertilizer 0.018 0.952 0.289 0.088 0.034 Agriculture − 0.117 − 0.409 0.903 0.053 0.009 Area 0.950 − 0.114 − 0.296 0.092 0.012 Insecticides 0.949 − 0.274 − 0.041 0.091 0.116 Air pollution 0.961 0.124 0.191 − 0.143 − 0.032 Non-methane pollutants 0.983 − 0.053 0.012 0.055 − 0.164 Ammonia 0.962 − 0.137 0.207 − 0.88 0.008 We reduced the number of variables in a Principal Component Analysis based on the correlation matrix and the varimax rotation. The three principal components with eigenvalues larger than 1.0 are listed. The PCA resulted in three eigen-values of 4.63, 1.20 and 1.05 accounting for an accumulated amount of variance of 83.3% of the variance. The first PC had weights of 0.950 for agricultural area, 0.949 for insecticides, 0.961 for air pollution, 0.983 for non-methane and 0.962 for ammonia. PC2 had a weight of 0.952 for fertilizer and PC3 had a weight of 0.903 for agriculture. Variables larger than 0.4 are generally considered to be significant and they are highlighted in bold font  下载: 导出CSV
Table 2 Multi-variate analysis of variance (MANOVA) for insect in relation to the abundance of Swift, House Martin and Barn Swallow
All between subject effects Value Exact F Numerator df Denominator df P All between 2.57 5.22 421 853 < 0.0001 Intercept 3.37 2877.39 1 853 < 0.0001 Locality 2.56 5.22 1 853 < 0.0001 All within interactions 0.09 4.86 842 1704 < 0.0001 Effects in bold font are significant at the 5% level
下载: 导出CSV
Table 3 Multi-variate analysis of variance (MANOVA) for principal component analysis (PCA) for pesticides, fertilizer and agricultural land-use in relation to the abundance of Swift, House Martin and Barn Swallow
All between Value Exact F Numerator df Denominator df P All between-subject effects 0.067 68.34 3 2957 < 0.0001 Intercept 0.923 2730.72 1 2957 < 0.0001 PC1 0.017 48.87 1 2957 < 0.0001 PC2 0.0002 0.74 1 2957 0.931 PC3 0.022 66.02 1 2957 < 0.0001 All within interactions 0.963 18.85 6 5912 < 0.0001 Species 0.769 1136.57 2 2956 < 00010 Species * PC1 0.026 37.87 2 2956 < 0.0001 Species * PC2 0.011 16.16 2 2956 < 0.0001 Species * PC3 0.016 23.97 2 2356 < 0.0001 Effects in bold font are significant at the 5% level
下载: 导出CSV
Table 4 Multi-variate analysis of variance (MANOVA) for principal component analysis (PCA) for pesticides, fertilizer and agriculture in relation to the number of juveniles and the number of adult Barn Swallows
All between Value Exact F Numerator df Denominator df P All between 0.095 11.84 3 374 < 0.0001 Intercept 0.720 269.31 1 374 < 0.0001 PC1 0.089 33.47 1 374 < 0.0001 PC2 0.002 8.68 1 374 0.417 PC3 0.014 5.26 1 374 0.022 All within interactions 0.070 8.87 3 374 < 0.0001 Female age 0.580 216.90 1 374 < 00010 Female age * PC1 0.026 9.63 1 374 0.002 Female age * PC2 0.001 0.47 1 374 0.49 Female age * PC3 0.045 16.76 1 374 < 0.0001 Effects in bold font are significant at the 5% level
下载: 导出CSV
Table 5 Multi-variate analysis of variance (MANOVA) for sex of Barn Swallows in relation to principal components for pesticides, fertilizer and agriculture
All between Value Exact F Numerator df Denominator df P All between-subject effects 0.114 14.22 3 375 < 0.0001 Intercept 0.801 300.47 1 375 < 0.0001 PC1 0.099 37.05 1 375 < 0.0001 PC2 0.0012 0.66 1 375 0.50 PC3 0.029 10.83 1 375 0.0011 All within interactions 0.092 11.52 3 375 < 0.0001 Date 0.003 1.16 1 375 < 0.0001 Date * PC1 0.035 13.23 1 375 0.00003 Date * PC2 0.006 2.23 1 375 0.14 Date * PC3 0.015 5.78 1 375 0.017 Effects in bold font are significant at the 5% level
下载: 导出CSV
-
-
期刊类型引用(15)
1. Yuan, Q., Lu, X., Mo, R. et al. Development and parentage analysis of SNP markers for Chestnut-vented Nuthatch (Sitta nagaensis) based on ddRAD-seq data. Avian Research, 2024.  必应学术
必应学术
2. Kumar, A., Tiwari, A., Narendran, P. et al. Genetic diversity and population structure of Aconitum heterophyllum- an endangered plant from North-western Himalayas using microsatellite markers. Medicinal Plants, 2023, 15(2): 390-401. 必应学术
3. Wang, L., Liu, F., Zhao, L. et al. A test of genetic divergence of a bird existing in the Sichuan Basin and its surrounding mountain ranges. Avian Research, 2023. 必应学术
4. Wang, H., Gao, S., Liu, Y. et al. A pipeline for effectively developing highly polymorphic simple sequence repeats markers based on multi-sample genomic data. Ecology and Evolution, 2022, 12(3): e8705. 必应学术
5. Ashrafzadeh, M.R., Khosravi, R., Fernandes, C. et al. Assessing the origin, genetic structure and demographic history of the common pheasant (Phasianus colchicus) in the introduced European range. Scientific Reports, 2021, 11(1): 21721. 必应学术
6. Aliakbari, Z., Kayvanfar, N., Rajabi-Maham, H. et al. Evidence for introgressive hybridization of wild black-necked pheasant with the exotic ring-necked pheasant during the past 50 years in the Hyrcanian zone, an integrative molecular and morphological approach. Journal of Zoological Systematics and Evolutionary Research, 2021, 59(7): 1516-1529. 必应学术
7. Gu, N., Chen, G., Yang, J. et al. Novel microsatellite markers reveal low genetic diversity and evidence of heterospecific introgression in the critically endangered Chinese Crested Tern (Thalasseus bernsteini). Global Ecology and Conservation, 2021. 必应学术
8. He, C., Zhao, L., Xiao, L. et al. Chromosome level assembly reveals a unique immune gene organization and signatures of evolution in the common pheasant. Molecular Ecology Resources, 2021, 21(3): 897-911. 必应学术
9. Wang, B., Wang, Y., Qu, J. Image Recognition in the Common Pheasant ( Phasianus colchicus) Subspecies | [雉鸡亚种种群的图像识别研究]. Chinese Journal of Wildlife, 2021, 42(2): 452-459. 百度学术
10. Ab Razak, S., Mad Radzuan, S., Mohamed, N. et al. Development of novel microsatellite markers using RAD sequencing technology for diversity assessment of rambutan (Nephelium lappaceum L.) germplasm. Heliyon, 2020, 6(9): e05077. 必应学术
11. Liu, Y., Liu, S., Zhang, N. et al. Genome Assembly of the Common Pheasant Phasianus colchicus: A Model for Speciation and Ecological Genomics. Genome Biology and Evolution, 2019, 11(12): 3326-3331. 必应学术
12. Wang, L., Yu, H., Li, Q. Development of microsatellite markers and analysis of genetic diversity of Barbatia virescens in the southern coasts of China. Genes and Genomics, 2019, 41(4): 407-416. 必应学术
13. Chen, G., Zheng, C., Wan, N. et al. Low genetic diversity in captive populations of the critically endangered Blue-crowned Laughingthrush (Garrulax courtoisi) revealed by a panel of novel microsatellites. Peerj, 2019, 2019(3): e6643. 必应学术
14. Liu, Y., Liu, S., Yeh, C.-F. et al. The first set of universal nuclear protein-coding loci markers for avian phylogenetic and population genetic studies. Scientific Reports, 2018, 8(1): 15723. 必应学术
15. Kayvanfar, N., Aliabadian, M., Niu, X. et al. Phylogeography of the Common Pheasant Phasianus colchicus. Ibis, 2017, 159(2): 430-442. 必应学术
其他类型引用(0)