The role of climate factors in geographic variation in body mass and wing length in a passerine bird
-
Abstract:Background
Geographic variation in body size is assumed to reflect adaptation to local environmental conditions. Although Bergmann's rule is usually sufficient to explain such variation in homeotherms, some exceptions have been documented. The relationship between altitude, latitude and body size, has been well documented for some vertebrate taxa during the past decades. However, relatively little information is available on the effects of climate variables on body size in birds.
MethodsWe collected the data of 267 adult Eurasian Tree Sparrow (Passer montanus) specimens sampled at 48 localities in China's mainland, and further investigated the relationships between two response variables, body mass and wing length, as well as a suit of explanatory variables, i.e. altitude, latitude, mean annual temperature (MAT), annual precipitation (PRC), annual sunshine hours (SUN), average annual wind speed (WS), air pressure (AP) and relative humidity (RH).
ResultsOur study showed that (1) although the sexes did not differ significantly in body mass, males had longer wings than females; (2) body mass and wing length were positively correlated with altitude but not with latitude; (3) body mass and wing length were negatively correlated with AP and RH, but not significantly correlated with WS. Body mass was positively correlated with SUN and inversely correlated with MAT. Wing length was not correlated with MAT in either sex, but was positively correlated with SUN and negatively correlated with PRC in male sparrows; (4) variation in body mass could be best explained by AP and SUN, whereas variation in wing length could be explained by RH and AP in both sexes. In addition, variation in male sparrows can be explained by SUN, WS and PRC but not in females.
ConclusionsTwo different proxies of body size, body mass and wing length, correlated with same geographic factors and different climate factors. These differences may reflect selection for heat conservation in the case of body mass, and for efficient flight in the case of wing length.
-
Keywords:
- Body mass /
- Wing length /
- Altitude /
- Latitude /
- Climate factor /
- Eurasian Tree Sparrow
-
Background
During migration birds face many challenges, including unfamiliar foraging and refuge habitats, resulting in a much higher rate of mortality during migration than during other seasons of the year. Weather may significantly affect a bird's decision to initiate migration, the course and pace of migration, and its survival during migration (Miller et al. 2016). Favourable weather conditions for migration enhance the orientation of birds, reduce the use of energy for flying and increase the speed of migration (Emlen 1975; Bloch and Bruderer 1982; Gauthreaux 1982; Akesson 1993; Liechti 2006; Shamoun-Baranes et al. 2017). According to the majority of the studies, most migrations take place in windless, clear, anticyclonic weather conditions without precipitation, or with support of tail winds (Alerstam 1990; Gyurácz et al. 1997, 2003; Bruderer and Boldt 2001; Erni et al. 2002). Favourable conditions can occur in different macrosynoptic weather situations (Kerlinger et al. 1989). Atmospheric conditions are the primary extrinsic factors influencing decisions regarding migratory flights, particularly over water bodies with limited opportunities to land (Richardson 1990). Wind plays a critical role, affecting departure date and migratory directions, routes, speeds, flight durations, energy consumption and the crossing of ecological barriers (Cochran and Kjos 1985; Weber and Hedenström 2000; Pennycuick and Battley 2003; Cochran and Wikeski 2005; Bowlin and Wikelski 2008; Shamoun-Baranes and van Gasteren 2011; Bulte et al. 2014; Gill et al. 2014). Decisions to depart stopover sites and initiate flight over large water bodies are also influenced by barometric pressure, temperature, relative humidity, and short-term trends in these variables, which are indicative of synoptic weather patterns and may provide information about future weather conditions (Able 1972; Newton 2008). In case of tail winds, birds are capable of flying longer distances while exerting less energy (Emlen 1975; Bloch and Bruderer 1982; Gauthreaux 1982, 1991; Alerstam 1990; Richardson 1990; Bruderer and Boldt 2001). Weather conditions that delay migration include cloudy skies, poor visibility, strong winds (head winds and cross winds), and warm or occluded fronts (Akesson 1993; Pyle et al. 1993).
The relationship between the migration of birds and various weather elements or atmospheric conditions was studied mostly in Europe (Alerstam 1978, 1990; Akesson 1993; Erni et al. 2002; Schaub et al. 2004; Van Belle et al. 2007; Arizaga et al. 2011) and North America (Able 1973; Emlen 1975; Kerlinger et al. 1989; Deppe et al. 2015; Woodworth et al. 2015). However, few studies are available for the migration of Siberian species, providing only limited information on autumn and spring migration phenology of some species (Williams 2000; Bozó and Heim 2015, 2016; Bozó et al. 2016, 2017; Sander et al. 2017), or focussing on their (irregular) occurrences in Europe (Rabøl 1969; Baker 1977; Folvik 1992; Berthold 1996; Thorup 1998, 2004; Phillips 2000; Krüger and Dierschke 2004; Harrop 2007; De Juana 2008; Jiguet and Barbet-Massin 2013). However, to understand the causes of the European vagrancies, information on migration phenology of this species related to local weather is necessary. Expanding this knowledge is not only important in understanding the causes of their vagrancy, but also for perspective conservation measures. Some of the East Asian migrants have declined dramatically (Kamp et al. 2015), and local declines are noted even in common species, e.g. in wintering Yellow-browed Warblers (Phylloscopus inornatus) on Hainan Island (Xu et al. 2017).
This study aims to describe the effects of various weather elements on the numbers of migrating Siberian breeding Phylloscopus warbler species at a stopover site in Far East Russia.
Methods
The study was carried out within the Amur Bird Project during spring(2013, 2015, 2016, 2017) and autumn (2011‒2014) migration at Muraviovka Park along the middle stream of the Amur River in the Russian Far East (Heim et al. 2012). The study site is located 60 km southeast of the city of Blagoveshchensk (49°55ʹ08.27ʺN, 127°40ʹ19.93ʺE).
The study periods were the following: in 2011, from 7 September to 15 October; in 2012, from 29 August to 15 October; in 2013, from 25 April to 08 June and from 27 July to 17 October; in 2014, from 25 July to 15 October; in 2015, from 25 April to 10 June; in 2016, from 25 April to 07 June, while in 2017, from 28 April to 08 June. During this period, in total 52 mist-nets were used for the work. Netting sites were not changed within season, however, the sampling effort varied among years (Table 1). The nets were set up in a variety of habitats: homogeneous reed-beds, sedges and grassy swamps interspersed with willows and raspberries, rich shrub-layered mixed forest, very dense scrub and stubble. The work was carried out daily from sunrise to sunset and the nets were checked every hour. In case of storm, heavy wind and rain, nets were closed.
Table 1. Sampling effort between 2011‒2017 at the study site (total number of nets × daily mist-netting hours)Year Season Spring Autumn 2011 - 6161 2012 - 14, 253 2013 9352 16, 654 2014 - 31, 235 2015 8204 - 2016 6710 - 2017 7729 - Data analysis was carried out based on 6191 individuals of four species: Yellow-browed Warbler (Phylloscopus inornatus), Dusky Warbler (P. fuscatus), Radde's Warbler (P. schwarzi) and Pallas's Leaf Warbler (P. proregulus) (Table 2). All birds were marked with rings of the Moscow Ringing Centre. Species identifications were based on Svensson (1992) and Brazil (2009). We only included data of first captures and excluded all recaptures.
Table 2. Number of ringed birds for all study species and their migration periods at Muraviovka ParkSpecies Number of birds Migration period Spring Autumn Spring Autumn Yellow-browed Warbler 2275 1584 26 April‒6 June 26 July‒13 October Dusky Warbler 497 1089 29 April‒9 June 26 July‒9 October Pallas's Leaf Warbler 79 369 29 April‒5 June 6 September‒17 October Radde's Warbler 81 217 9 May‒8 June 5 August‒26 September To analyse the effects of weather for bird migration, we collected the following weather data for every day: minimum and maximum temperature (℃), precipitation (mm), average air pressure (mb), average wind speed (Beaufort scale 0‒12), average wind direction (cross winds: E and W winds in spring and autumn; tail winds: N, NE and NW in autumn and S, SE and SW in spring; head winds: N, NE and NW in spring and S, SE and SW in autumn). Air pressure and precipitation data were gathered from the webpage of World Weather Online (World Weather Online 2017) for the area of Blagoveshchensk, while the remaining data were collected by the ringing teams at Muraviovka Park.
The migration periods are species-specific, therefore it was necessary to determine migration periods for each species. On the basis of the daily numbers caught, migration periods were determined for all studied species (Fig. 1). Only days within the migration period were considered in the following models.
![Figure 1. Spring (left) and autumn (right) migration periods of the four leaf warbler species]() Figure 1. Spring (left) and autumn (right) migration periods of the four leaf warbler species
Figure 1. Spring (left) and autumn (right) migration periods of the four leaf warbler speciesGeneral Linear Mixed Models (GLMM) were used to evaluate the weather impact on the number of trapped birds per day. Models were built for each species for both spring and autumn season. Year and Julian day were included as random factors. Minimum temperature was excluded from the models, as it was highly correlated with maximum temperature (R = 0.77, t = 30.2, df = 722, p < 0.001). The full models were of the following structure:
the number of birds trapped per day
~ temperature + precipitation + air pressure
+ wind speed + wind direction + 1|year + 1|day.
Furthermore, we built a model for all four species together, and included species as additional random factor as well. We checked for overdispersion using the dispersion-glmer function of the R package blmeco. For analysis, R version 3.4.2 (R Core Team 2017) and packages lme4 (Bates et al. 2014) and piecewiseSEM (Lefcheck 2016) were used.
Results
The migration periods of the four study species are shown in Table 2.
The GLMM for single species explained only a small part of the variability, with higher values during autumn migration (Rmarg 2 : 0.07‒0.18) compared to spring migration (Rmarg2 : 0.03‒0.10). This was also true for the overall model, including all four species—see Table 3. Much more of the variance was explained by the random factors (Rcond 2) (Table 3).
Table 3. Outputs of general linear mixed modelsSpecies Spring migration Autumn migration Estimate χ2 p Estimate χ2 p ALL Temperature 0.42 133.3 *** Temperature 0.22 18.4 *** Precipitation 0.09 8.7 0.003 Precipitation - 0.53 121.4 *** Air pressure ‒0.10 9.4 0.002 Air pressure - 0.25 39.3 *** Wind speed 0.09 9.3 0.002 Wind speed - 0.29 65.6 *** Wind direction 65.8 *** Wind direction 54.6 *** Headwind - 0.30 Headwind - 0.39 Crosswind - 0.05 Crosswind - 0.17 Tailwind - 0.72 Tailwind 0.08 Rmarg 2 0.03 Rmarg 2 0.12 Rcond 2 0.82 Rcond 2 0.84 Dusky Warbler Temperature 0.41 17.0 *** Temperature 0.35 16.9 *** Precipitation 0.09 1.0 0.321 Precipitation - 0.50 37.7 *** Air pressure - 0.01 0.0 0.861 Air pressure - 0.13 4.3 0.039 Wind speed 0.08 1.0 0.310 Wind speed - 0.09 2.4 0.121 Wind direction 17.0 *** Wind direction 18.8 *** Headwind 0.42 Headwind 0.29 Crosswind 1.12 Crosswind 0.53 Tailwind 0.08 Tailwind 0.76 Rmarg 2 0.09 Rmarg 2 0.18 Rcond 2 0.75 Rcond 2 0.84 Pallas's Leaf Warbler Temperature 0.40 5.2 0.022 Temperature - 0.27 2.3 0.126 Precipitation 0.01 0.0 0.946 Precipitation - 0.24 2.2 0.137 Air pressure - 0.03 0.0 0.870 Air pressure 0.10 0.7 0.417 Wind speed 0.02 0.0 0.900 Wind speed - 0.43 13.1 *** Wind direction 4.7 0.096 Wind direction 6.3 0.043 Headwind - 1.11 Headwind - 2.05 Crosswind - 0.34 Crosswind - 1.74 Tailwind - 1.35 Tailwind - 1.51 Rmarg 2 0.09 Rmarg 2 0.07 Rcond 2 0.34 Rcond 2 0.71 Radde's Warbler Temperature 0.56 8.9 0.003 Temperature 0.38 5.9 0.016 Precipitation 0.00 0.0 0.993 Precipitation - 0.45 8.5 0.004 Air pressure 0.01 0.0 0.932 Air pressure - 0.54 16.2 *** Wind speed 0.13 0.7 0.399 Wind speed - 0.27 16.2 0.022 Wind direction 2.5 0.292 Wind direction 6.3 0.043 Headwind - 1.12 Headwind - 2.07 Crosswind - 1.17 Crosswind - 1.41 Tailwind - 1.67 Tailwind - 1.77 Rmarg 2 0.10 Rmarg 2 0.13 Rcond 2 0.44 Rcond 2 0.70 Yellow-browed Warbler Temperature 0.44 118.6 *** Temperature 0.21 7.5 0.006 Precipitation 0.09 7.1 0.008 Precipitation - 0.57 68.7 *** Air pressure - 0.14 16.4 *** Air pressure - 0.32 24.6 *** Wind speed 0.08 6.6 0.010 Wind speed - 0.45 71.3 *** Wind direction 46.1 *** Wind direction 27.6 *** Headwind 0.98 Headwind 0.39 Crosswind 1.12 Crosswind 0.59 Tailwind 0.57 Tailwind 0.89 Rmarg 2 0.03 Rmarg 2 0.18 Rcond 2 0.94 Rcond 2 0.92 Estimates refer to the slope related to the variables, but represent the mean for categorical variables (wind direction, in italics). Shown are test statistics, Rmarg 2 (fixed factors alone) and Rcond 2 (fixed + random factor). p values below 0.001 are marked as *** During spring, the most important factor for all species is temperature, with significantly more birds trapped during warmer days. Furthermore, wind direction is a significant predictor in the overall model and in two out of four species models, with the highest number of birds trapped during cross winds.
In autumn, the number of trapped warblers is negatively affected by precipitation and wind speed, while maximum temperature is positively related with the number of trapped individuals in the overall model and in three out of four species. Wind direction is an important factor in all models, with most birds trapped during tail wind, and least birds during head winds. Air pressure was found to have minor impact on the numbers, but a negative relation was found in three out of four species.
Discussion
During our work, the effects of air pressure, rainfall, temperature, wind strength and wind direction were investigated for four species. We found strong impacts of weather variables on the number of trapped warblers during spring and autumn migration. Overall, preferred or avoided weather conditions were similar among the studied species, but some slight differences were found.
All species seem to migrate preferably during warm, calm days without precipitation in spring and autumn too. It is important to note that in case of intense rainy weather, mist-nets were closed for the safety of the birds, but there would certainly not have been a significant amount of bird in these days. The fact, that the maximum temperature is positively related with the number of trapped individuals in the overall model and in three out of four species is certainly associated with the timing of migration.
Previous studies have shown that the migration peak of most species coincides with days of high air pressure (Alerstam 1990; Gyurácz et al. 1997). On such days, there is constant sunshine and low temperatures. In Siberia, a high anti-cyclone reigns from September to April, with its centre near Lake Baikal. This Siberian cycle is often characterized by high air pressures above 1040 mb and extremely low temperatures (Oliver 2005). In spring, however, the effects of cyclones are characterized by high precipitation and high temperature values. In contrast, air pressure was found to have minor impact on the numbers of trapped warblers both during spring and autumn migration, but a slight negative relation was found in three out of four species in autumn. This suggests that the studied species seem to migrate independently from the air pressure.
Both the strength and the direction of the wind can be decisive in the timing of migration (Elkins 1988). In stormy winds, mist-netting is not possible, but as during heavy rains, few birds are expected to fly during such conditions. Accordingly, the number of birds of all species and the strength of wind were negatively correlated in spring and autumn migration.
In autumn, in cases of a northerly wind (tail wind), birds are known to fly longer distances while exerting less energy (Emlen 1975; Bloch and Bruderer 1982; Gauthreaux 1982, 1991; Alerstam 1990; Richardson 1990). Accordingly, we would expect the highest numbers of migrating birds in autumn during northern tail winds and in spring during southern tail winds. However, a positive effect of tail winds was only confirmed in autumn. Tail winds were a good predictor in case of Dusky and Yellow-browed Warblers in autumn, which may support the weather hypothesis, according to which some authors explain the westward vagrancy of Siberian leaf warblers species by the effect of the weather (Baker 1977; Howey and Bell 1985; Baker and Catley 1987). It is interesting to note that in spring, most birds were trapped during cross winds (eastern or western winds). It seems likely, that the studied warbler species exhibit a loop migration, with their spring migration routes closer to the East Asian coasts, leading to a more longitudinal migration pattern (from east to west) in our study area during spring (Fig. 2). The Wood Warbler (Phylloscopus sibilatrix) and Willow Warbler (Ph. trochilus), well-studied European breeding species, show also loop migration (Gyurácz and Csörgő 2009; Jónás et al. in press), and a similar pattern was found for geolocator-tracked Siberian Rubythroats (Calliope calliope) along the East Asian flyway (Heim et al. 2018a).
![Figure 2. Breeding and wintering grounds, and the supposed migration route of the study species. The study site (Muravovka Park) is also marked on the map. Distribution maps for each species based on The IUCN Red List of Threatened Species (2018)]() Figure 2. Breeding and wintering grounds, and the supposed migration route of the study species. The study site (Muravovka Park) is also marked on the map. Distribution maps for each species based on The IUCN Red List of Threatened Species (2018)
Figure 2. Breeding and wintering grounds, and the supposed migration route of the study species. The study site (Muravovka Park) is also marked on the map. Distribution maps for each species based on The IUCN Red List of Threatened Species (2018)Despite the significant impacts of the weather variables, most of the variation was explained by interannual differences and preferred migration timing. The studied species are likely mainly following their innate migration schedule. Consistent migration timing between years was also found for Emberiza buntings at our study site (Heim et al. 2018b). This might especially be true for spring migration, when competition is high to arrive early at the breeding grounds (Nilsson et al. 2013), which could force individuals to continue migration under sub-optimal weather conditions.
Global change is expected to significantly alter weather conditions in Far East Russia (Mokhov and Semenov 2016) and a better understanding of how these factors could influence migratory birds is urgently required.
Conclusion
During our work we found strong impacts of weather variables (air pressure, rainfall, temperature, wind strength and wind direction) on the number of trapped warblers during spring and autumn migration. Birds seem to migrate preferably during warm, calm days without precipitation, however, relationships between weather variables and the number of migrating individuals were much stronger during autumn. Air pressure was found to have minor impact on the numbers of trapped warblers, while the strength and the direction of wind were important variables. Tail winds play an important role in autumn, but in spring migration was determined by cross winds, which indicates that the studied species might exhibit a loop migration.
Authors' contributions
LB and WH collected field data. TCS provided new ideas for this manuscript. LB and WH performed data analyses. LB collected the weather data from the online dataset. LB wrote an early version of the manuscript. WH and TCS revised and improved the manuscript. All authors read and approved the final manuscript.
Acknowledgements
The authors want to thank Sergei M. Smirenski and the staff of Muraviovka Park as well as the Amur Bird Project field teams for enabling these studies in Far East Russia. We kindly acknowledge the provision of rings by the Moscow Bird Ringing Centre, and thank Ramona J. Heim and Johannes Kamp for helpful comments on the statistical analysis.
Competing interests
The authors declare that they have no competing interests.
Availability of data and materials
The datasets used and/or analysed during the current study are available from the corresponding author on reasonable request.
Ethics approval and consent to participate
The authors confirm that all experiments were carried out under the current law for scientific bird ringing in Russia, and all necessary permissions were obtained.
-
![]()
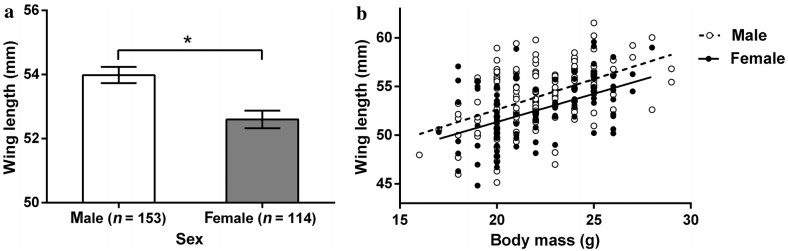
Figure 1. Sexual size dimorphism in wing length and body mass in Passer montanus. a Mean male and female wing length (mean ± SE, the asterisk represents a statistically significant difference between the sexes). b Relationship between wing length and body mass (males: df = 151, t = 3.856, p < 0.001, open circles and dashed lines; females: df = 112, t = 4.459, p < 0.001, black dots and solid lines)
![]()
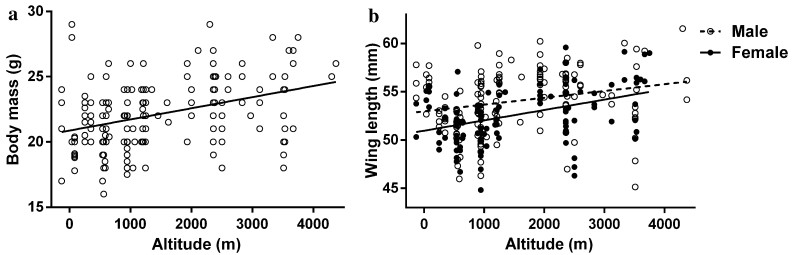
Figure 2. Correlations between body mass or wing length of P. montanus and altitude. a Body mass vs altitude (df = 218, t = 4.125, p < 0.001), b wing length versus altitude (male: df = 113, t = 2.972, p = 0.004, open circles and dashed lines; female: df = 77, t = 2.811, p = 0.006, black dots and solid lines)
![]()
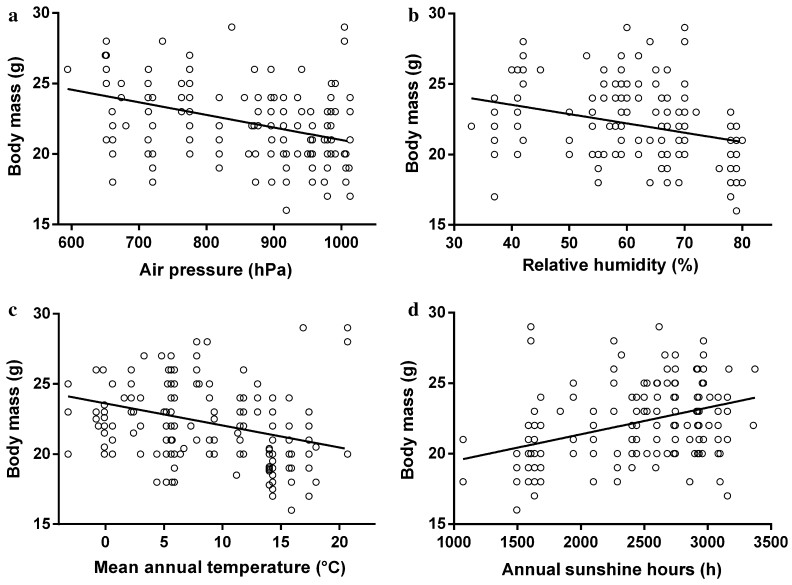
Figure 3. Correlations between body mass of P. montanus and climate factors. a Air pressure (df = 46, t = -4.088, p < 0.001), b relative humidity (df = 46, t = -2.768, p = 0.006), c mean annual temperature (df = 46, t = -2.243, p = 0.026) and d annual sunshine hours (df = 46, t = 2.751, p = 0.006), at collection sites
![]()
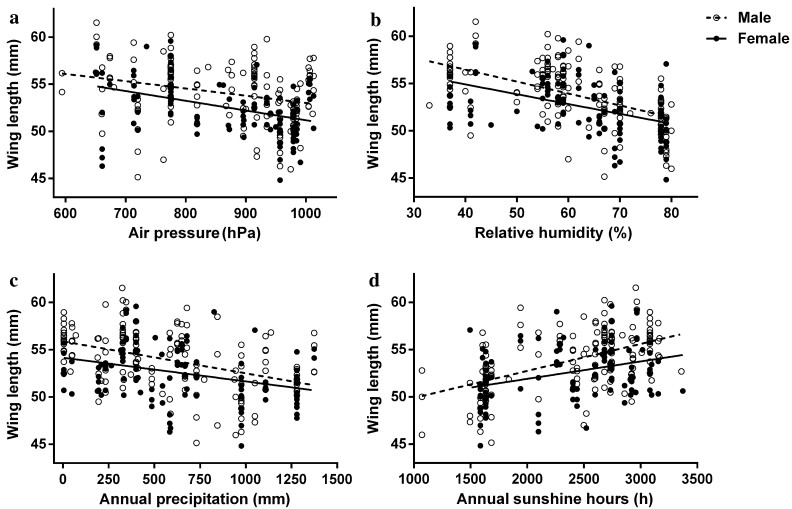
Figure 4. Correlations between wing length of P. montanus and climate factors. a Air pressure (male: df = 37, t = -2.643, p = 0.012; female: df = 34, t = -2.087, p = 0.008), b relative humidity (male: df = 37, t = -5.407, p < 0.001; female: df = 34, t = -2.027, p = 0.046), c annual precipitation (males: df = 37, t = -2.884, p = 0.007; female: df = 34, t = -0.559, p = 0.580), and d annual sunshine hours (males: df = 37, t = 4.605, p < 0.001; female: df = 34, t = 0.325, p = 0.746), at collection sites. Data on males are shown as open circles and dashed lines and those on females as black dots and solid lines
Table 1 Correlations between body mass or wing length of P. montanus and geographic and climate factors
Variable Statistical parameter Altitude Latitude MAT AP PRC SUN RH WS Body mass df 218 218 46 46 46 46 46 46 Estimate 0.001 -0.026 -0.123 -0.010 -0.001 0.002 -0.070 0.422 t 4.125 -0.518 -2.243 -4.088 -1.542 2.751 -2.768 1.138 p < 0.001 0.605 0.026 < 0.001 0.130 0.006 0.006 0.261 Wing length Male df 113 113 37 37 37 37 37 37 Estimate 0.001 -0.052 -0.004 -0.009 -0.003 0.002 -0.129 0.167 t 2.972 -0.868 -0.060 -2.643 -2.884 4.065 -5.407 0.341 p 0.004 0.388 0.952 0.012 0.007 < 0.001 < 0.001 0.735 Female df 77 77 34 34 34 34 34 34 Estimate 0.001 -0.123 0.052 -0.009 -0.001 0.000 -0.067 -0.557 t 2.811 -2.014 0.682 -2.807 -0.559 0.325 -2.027 -1.031 p 0.006 0.050 0.497 0.008 0.580 0.746 0.046 0.310 Estimate model coefficients, df degree of freedom, MAT mean annual temperature, PRC annual precipitation, SUN annual sunshine hours, WS annual average wind speed, AP air pressure, RH relative humidity. Data on the body mass of each sex were pooled but wing length data were analyzed separately for each sex  下载: 导出CSV
Table 2 Coefficients of averaged models explaining body mass and wing length (male and female) in relation to climate factors
Variable Factor Estimate SE P value Lower CI Upper CI Relative importance Body mass (Intercept) 24.181 2.493 < 0.001 19.287 29.075 AP -0.008 0.001 < 0.001 -0.010 -0.005 1.00 SUN 0.002 0.001 0.001 0.001 0.003 0.96 PRC 0.001 0.001 0.453 0.0004 0.003 0.54 Wing length Male (Intercept) 57.864 4.750 < 0.001 48.517 67.211 SUN 0.002 0.001 0.018 0.001 0.004 0.97 WS -0.740 0.428 0.085 -1.537 -0.141 0.88 RH -0.099 0.052 0.057 -0.182 -0.051 0.85 AP -0.004 0.003 0.149 -0.009 < 0.001 0.84 PRC 0.002 0.001 0.256 0.000 0.005 0.68 MAT 0.022 0.054 0.688 0.054 0.229 0.15 Female (Intercept) 66.425 2.666 < 0.001 61.158 71.693 RH -0.130 0.060 0.030 -0.248 -0.012 1.00 AP -0.006 0.003 0.063 -0.012 -0.003 0.85 PRC 0.001 0.002 0.502 -0.001 0.007 0.47 WS -0.376 0.529 0.479 -1.798 0.118 0.45 MAT -0.035 0.089 0.691 -0.384 -0.084 0.15 Estimate average model coefficients, SE unconditional standard errors, Lower CI and Upper CI the 95% confidence limits, AP air pressure, PRC annual precipitation, SUN annual sunshine hours, RH relative humidity, WS annual average wind speed, MAT mean annual temperature
More information for top-ranked models are shown in Additional file 1: Table S3
下载: 导出CSV
-
-
期刊类型引用(19)
1. Béasse, S., Sallé, L., Coiffard, P. et al. Quantifying nocturnal bird migration using acoustics: opportunities and challenges. Remote Sensing in Ecology and Conservation, 2025.  必应学术
必应学术
2. Gobbens, E., Beardsworth, C.E., Dekinga, A. et al. Environmental factors influencing red knot (Calidris canutus islandica) departure times of relocation flights within the non-breeding period. Ecology and Evolution, 2024, 14(3): e10954. 必应学术
3. Bozó, L., Csörgő, T. Causes of vagrancy of North Asian passerines in western Europe. Ibis, 2024, 166(1): 5-22. 必应学术
4. Scott, K.M., Danko, A., Plant, P. et al. What causes bird-building collision risk? Seasonal dynamics and weather drivers. Ecology and Evolution, 2023, 13(4): e9974. 必应学术
5. Bozó, L., Anisimov, Y., Heim, W. Differences in migration phenology of warblers at two stopover sites in eastern Russia suggest a longitudinal migration pattern. Avian Research, 2023. 必应学术
6. Pinszke, A., Remisiewicz, M. Long-term changes in autumn migration timing of Garden Warblers Sylvia borin at the southern Baltic coast in response to spring, summer and autumn temperatures. European Zoological Journal, 2023, 90(1): 283-295. 必应学术
7. Kittelberger, K.D., Miller, M.K., Şekercioğlu, Ç.H. Fall bird migration in western North America during a period of heightened wildfire activity | [Migration automnale d’oiseaux dans l’ouest de l’Amérique du Nord en période intense d’incendies de forêt]. Avian Conservation and Ecology, 2022, 17(2): 43. 必应学术
8. Collet, L., Heim, W. Differences in stopover duration and body mass change among Emberiza buntings during autumn migration in the Russian Far East. Journal of Ornithology, 2022, 163(3): 779-789. 必应学术
9. Liu, C., Cui, G., Liu, S. CGCNImp: A causal graph convolutional network for multivariate time series imputation. Peerj Computer Science, 2022. 必应学术
10. Prytula, E.D., McKellar, A.E., Schwitters, L. et al. Rapid advancement of spring migration and en route adjustment of migration timing in response to weather during fall migration in Vaux’sSwifts(Chaetura vauxi). Canadian Journal of Zoology, 2022, 100(999): 56-63. 必应学术
11. Allcock, J.A., Bonebrake, T.C., Sung, Y.H. et al. Shifts in phenology of autumn migration and wing length among reedbed passerines along the East Asian–Australasian Flyway. Avian Research, 2022. 必应学术
12. Hamer, T.E., Denis, N., Cardoso, T.P. et al. Influence of local weather on collision risk for nocturnal migrants near an electric power transmission line crossing Kittatinny Ridge, New Jersey. Wilson Journal of Ornithology, 2021, 133(2): 190-201. 必应学术
13. Yong, D.L., Heim, W., Chowdhury, S.U. et al. The State of Migratory Landbirds in the East Asian Flyway: Distributions, Threats, and Conservation Needs. Frontiers in Ecology and Evolution, 2021. 必应学术
14. Bozó, L., Csörgő, T., Heim, W. Factors controlling the migration phenology of Siberian Phylloscopus species. Journal of Ornithology, 2021, 162(1): 53-59. 必应学术
15. Bozó, L., Anisimov, Y., Csörgő, T. Association of weather variables with the migration phenology and body conditions of Siberian warblers. Ornis Fennica, 2021, 98(4): 162-174. 必应学术
16. Bozó, L., Csörgo, T., Heim, W. Stopover Duration and Body Mass Change of Two Siberian Songbird Species at a Refuelling Site in the Russian Far East. Ornithological Science, 2020, 19(2): 159-166. 必应学术
17. Xianghuang, L.I., Wang, X., Fang, L. et al. Annual migratory patterns of Far East Greylag Geese (Anser anser rubrirostris) revealed by GPS tracking. Integrative Zoology, 2020, 15(3): 213-223. 必应学术
18. Bozó, L., Csörg, T., Anisimov, Y. Estimation of Flight Range of Migrant Leaf-Warblers at Lake Baikal. Ardeola, 2020, 67(1): 57-67. 必应学术
19. Sander, M.M., Heim, W., Schmaljohann, H. Seasonal and diurnal increases in energy stores in migratory warblers at an autumn stopover site along the Asian–Australasian flyway. Journal of Ornithology, 2020, 161(1): 73-87. 必应学术
其他类型引用(0)