Inaccuracies in the history of a well-known introduction: a case study of the Australian House Sparrow (Passer domesticus)
-
Abstract:Background
Modern ecosystems contain many invasive species as a result of the activity of acclimatisation societies that operated in the second half of the nineteenth century,and these species provide good opportunities for studying invasion biology. However,to gain insight into the ecological and genetic mechanisms that determine the rate of colonization and adaptation to new environments,we need a good understanding of the history of the introduced species,and a knowledge of the source population,timing,and number of individuals introduced is particularly important. However,any inaccuracies in the history of an introduction will affect subsequent assumptions and conclusions.
MethodsFocusing on a single well-known species,the House Sparrow (Passer domesticus),we have documented the introduction into Australia using primary sources (e.g. acclimatisation records and newspaper articles).
ResultsOur revised history differs in a number of significant ways from previous accounts. Our evidence indicates that the House Sparrow was not solely introduced from source populations in England but also from Germany and most strikingly also from India—with the latter birds belonging to a different race. We also clarify the distinction between the number released and the number of founders,due to pre-release captive breeding programs,as well as identifying inaccuracies in a couple of well-cited sources with respect to the range expansion of the introduced populations.
ConclusionsOur work suggests that caution is required for those studying introductions using the key sources of historical information and ideally should review original sources of information to verify the accuracy of published accounts.
-
Keywords:
- Acclimatisation /
- Bottlenecks /
- Propagule size /
- Range expansion /
- Hybridisation
-
Introduction
Mist netting is one of the most commonly used methods to study the abundance and diversity of birds. However, Remsen and Good (1996) claimed that mist netting cannot be used to provide reliabe estimates of relative abundance. The effectiveness of mist nets in providing unbiased measures of avian diversity is impacted by mesh size (Piratelli, 2003), visibility and weather conditions (Karr, 1981; Jenni et al., 1996), habitat type (Rappole et al., 1998; Lövei et al., 2001), bird size (Jenni et al., 1996; Piratelli, 2003), flight height (Fitzgerald et al., 1989; Whitman et al., 1997), breeding status (Pagen et al., 2002) and territorial behavior (Remsen and Good, 1996). These factors can bias the results of observational surveys as well (Blake and Loiselle, 2000). For secretive and non-territorial species or species which seldom vocalize, mist netting may be comparatively more effective as a survey tool in relation to visual and aural surveys (Karr, 1981). Mist netting is particularly effective in collecting data on understory species (Karr, 1990; Blake and Loiselle, 1991, 2001; Dunn and Ralph, 2004).
Hainan Island is off the coast of southern China and home to a growing list of endemic avian species. Currently the biota of the island is under considerable threat from habitat destruction, providing a need for accurate surveys of its avifauna. The present study examined the relative effectiveness of mist netting in characterizing the forest avifauna of Hainan through the following metrics: 1) the relationship between visual and aural observations based on point counts and captures from mist netting in avian richness and abundance, 2) the relationship between activity height and capture rate and 3) the relationship between light intensity and capture rate.
Methods
Study area
The study was conducted at the Jianfengling Forest Area (18°23′–18°52′N, 108°36′–109°05′E), which covers 600 km2 in southwestern Hainan Island and ranges in elevation from sea level to 1413 m (Fig. 1). The climate is that of a tropical monsoon area, with a wet season from May to October and a dry season from November to April. The mean annual temperature is 24.5℃ and the annual rainfall 1600–2600 mm.
![Figure 1. Sample sites of three vegetation types for semi-deciduous monsoon forest (SDM), evergreen monsoon forest (EMF) and montane rain forest (MRF). Mossy forest on top of the mountain (MFT) was not sampled (see text). Numbers 1, 2 and 3 represent sampling locations in MRF, EMF and SDM, respectively.]() Figure 1. Sample sites of three vegetation types for semi-deciduous monsoon forest (SDM), evergreen monsoon forest (EMF) and montane rain forest (MRF). Mossy forest on top of the mountain (MFT) was not sampled (see text). Numbers 1, 2 and 3 represent sampling locations in MRF, EMF and SDM, respectively.
Figure 1. Sample sites of three vegetation types for semi-deciduous monsoon forest (SDM), evergreen monsoon forest (EMF) and montane rain forest (MRF). Mossy forest on top of the mountain (MFT) was not sampled (see text). Numbers 1, 2 and 3 represent sampling locations in MRF, EMF and SDM, respectively.Jianfengling Forest Area has more than 2800 plant species and four vegetation types (Fig. 1): 1) a semi-deciduous monsoon forest (SDM) in the foothills and mountains at elevations between 100 and 400 m, 2) an evergreen monsoon forest (EMF) primarily in a hillside belt at 300–700 m elevation with a high abundance of trees of the genus Vatica, a predominant component of tropical rainforests in Asia, 3) a tropical montane rainforest (MRF) with the highest tree species richness of the four vegetation types and occurs mainly at 600–1100 m elevation, including a large number of old and tall trees with large plank buttresses and a great variety of epiphytes, parasitic vines and creepers, and 4) a mossy forest (MFT) covering a very small area on foggy mountain tops and ridges over 1100 m (Zeng et al., 1997).
Bird sampling
Birds were sampled on eight occasions, four during the wet season (May 2000, June 2001, October 2001 and September 2004) and four during the dry season (November 2000, February 2001, January 2002 and March 2002) and in three vegetation types (MRF, EMF and SDM). Birds of the mossy forest were not sampled because of their small size and access is difficult. Bird surveys in each vegetation type were conducted using fixed-radius (30 m) point counts and mist nets. At least 20 points were established on three preexisting trails for each type. All point count locations were identified by GPS (Global Positioning System, Garmin corporation, accuracy < 10 m) and the mean linear distance between nearest points in the same trail was 184.0 ± 6.5 m (n = 54). During point count periods, each point was surveyed for 10 min between 06:30 and 10:30 hours. All birds detected visually or aurally within approximately 30 m of the observer were recorded along with the estimated distance between the birds and the observer and the activity height of the bird. All points of each type were surveyed within a three-day period provided there was no strong wind or rain. Mist nets of 12 m in length, 2.6 m in height and with 36 mm mesh were used to capture birds. The center of each net site was recorded using GPS (Table 1). Nets were installed where vegetation and topography permitted and all nets were in the forest interior. Ten nets were operated simultaneously at each site. The same sampling trails and net sites were used throughout the study period. Nets were opened for 3–4 consecutive days between approximately 06:30 and 17:30 hours on days without rain or strong wind for each period. Nets were checked at intervals of about one hour. Birds were banded using numbered aluminum leg-rings, freely supplied by the National Bird Banding Center of China. After banding, all birds were immediately released at the capture site to minimize disruption of their normal movements. Time, location, species and ring code (for recaptured birds) were recorded. Light intensity was measured by DER EE Digital Light Meter (Liquid Crystal Display, made in Shanghai) at 08:00, 10:00, 12:00, 14:00 and 16:00. Five points (0, 3, 6, 9 and 12 m along the net) were selected for each net.
Table 1. Location of sample sitesPosition MRF EMF SDM East longitude 108°51.88′ 108°53.40′ 108°47.44′ North latitude 18°44.49′ 18°46.77′ 18°42.61′ Range of elevation (m) 889–1025 482–555 190–285 Data analysis
The migratory status of birds was based on Xu et al. (1983). "Abundant species" were those representing more than 10% of total captures (Zheng, 1995). "Rare species" were those representing less than 2% of total captures (Karr, 1971). All data were examined for normality using Kolmogorov-Smirnov tests. The relationships between observation numbers and capture numbers and light intensity and capture numbers were determined by Spearman's rank correlation coefficient. The nonparametric Kruskal-Wallis test was used to test differences of light intensity between net-days. All analyses were conducted with SPSS 16.0 except for the rarefaction analysis. EcoSim was used to compute species accumulation curves based on rarefaction (Gotelli and Entsminger, 2001).
Results
Mist netting data
Mist nets were operated for a total of 7135 net-hours. A total of 587 individuals representing 45 bird species were captured. A species accumulation curve predicted very slow growth for further sampling. The total mean capture rate during eight survey periods was 8.6 ± 10.4 per 100 net-hours (n = 237). Passerines dominated the understory avian community, accounting for 86.7% of all species and 96.9% of total captures. The only species accounting for more than 10% of total captures was the Grey-cheeked Fulvetta (Alcippe morrisonia), which accounted for 38.7% of total captures. Rare species comprised 75.6% of species. Resident birds were the major component of the understory bird community, accounting for more than 80.0% of all species and 93.7% of total captures. Only nine long-distance migratory species (including one passage migrant and eight winter visitors) were captured (Table 2). Migratory birds accounted for a small proportion of total captures (6.3%).
Table 2. Species list of birds captured at Jianfengling aCommon name Scientific name Captures b NV c NT d M e Activity height (m) f Emerald Dove Chalcophaps indica 4 − − R − Cuckoo Owl Glaucidium cuculoides 8 4 20 R 10.7 ± 3.0 (3) Collared Pygmy Owl Glaucidium brodiei 1 4 17 R 11.7 ± 3.3 (3) Red-headed Trogon Harpactes erythrocephalus 2 25 45 R 9.9 ± 1.2 (17) Blue-bearded Bee-eater Nyctyornis athertoni 1 16 47 R 14.9 ± 4.9 (7) Black-browed Barbet Megalaima oorti 2 13 158 R 13.5 ± 2.4 (10) Silver-breasted Broadbill Serilophus lunatus 26 66 68 R 12.0 ± 1.4 (12) Blue-rumped Pitta Pitta soror 3 3 3 R 0 (2) White-throated Bulbul Alophoixus pallidus 46 265 480 R 8.3 ± 1.9 (105) Green-winged Bulbul Hypsipetes mcclellandii 5 28 52 R 12.2 ± 1. 8 (13) Chestnut Bulbul Hemixos castanonotus 5 123 354 R 11.3 ± 3.0 (27) Black Drongo Dicrurus macrocercus 1 15 19 R 16.0 ± 1.0 (8) Bronzed Drongo Dicrurus aeneus 5 95 139 R 16.6 ± 4.2 (41) Greater Racket-tailed Drongo Dicrurus paradiseus 2 37 43 R 12.6 ± 2.1 (15) Yellow-breasted Green Magpie Cissa hypoleuca 2 − − R − Gray Treepie Dendrocitta formosae 1 9 30 R 13.0 (5) Racket-tailed Treepie Temnurus temnurus 1 12 13 R 14.9 ± 2.4 (7) Red-tailed Robin Luscinia sibilans 8 1 1 W 0.5 (1) Red-flanked Bush Robin Luscinia cyanurus 9 2 2 W 5.0 (1) White-rumped Shama Copsychus malabaricus 11 16 19 R 3.9 ± 1.3 (6) White-crowned Forktail Enicurus leschenaulti 13 30 86 R 0 (22) Orange-headed Ground Thrush Zoothera citrina 11 − − R − Golden Mountain Thrush Zoothera dauma 2 1 1 W 0 (1) Grey Thrush Turdus cardis 12 4 4 W 0 (1) Blue-and-white Flycatcher Cyanoptila cyanomelaena 1 1 1 W − Fujian Niltava Niltava davidi 1 1 1 W − Hainan Blue Flycatcher Cyornis hainanus 13 37 81 R 4.0 ± 0.5 (26) White-throated Fantail Rhipidura albicollis 4 19 24 R 4.5 ± 0.8 (14) Black-naped Monarch Hypothymis azurea 13 32 33 R 8.8 ± 1.3 (21) Lesser Necklaced Laughingthrush Garrulax monileger 4 5 6 R 6.5 ± 5.0 (2) Greater Necklaced Laughingthrush Garrulax pectoralis 3 9 22 R 8.1 ± 2.1 (5) Grey Laughingthrush Garrulax maesi 1 23 129 R 3.7 ± 1.7 (3) Black-throated Laughingthrush Garrulax chinensis 8 42 197 R 3.0 ± 0.9 (15) Large Scimitar Babbler Pomatorhinus hypoleucos 1 2 9 R 0.3 (1) Rufous-necked Scimitar Babbler Pomatorhinus ruficollis 42 46 217 R 1.1 ± 0.3 (18) Lesser Wren Babbler Napothera epilepidota 3 2 2 R 1.2 (1) Rufous-capped Babbler Stachyris ruficeps 17 79 142 R 4.9 ± 1.2 (19) Spot-necked Babbler Stachyris striolata 7 2 2 R 0.5 (1) Gould's Fulvetta Alcippe brunnea 23 73 258 R 2.1 ± 0.4 (28) Grey-cheeked Fulvetta Alcippe morrisonia 227 1376 1687 R 3.5 ± 0.2 (178) White-bellied Yuhina Erpornis zantholeuca 24 459 553 R 7.5 ± 0.6 (74) Grey-headed Parrotbill Paradoxornis gularis 10 112 112 R 10.3 ± 2.5 (6) Dusky Warbler Phylloscopus fuscatus 1 2 2 W 6.0 (1) Pale-legged Leaf Warbler Phylloscopus tenellipes 2 3 3 P 3.5 ± 1.5 (2) Blyth's Leaf Warbler Phylloscopus reguloides 1 − − W − a Classification based on Zheng (2005).
b Captures: capture number.
c NV: Visual observation number.
d NT: Total observation number (visual + aural).
e Migratory status based on Xu et al. (1983): resident (R), winter visitor (W) and passage migrant (P).
f Sample number in brackets.Detections by point counts and consistency with mist netting data
During point counts, a total of 107 bird species comprising 4932 individuals were visually recorded and 120 species comprising 7616 individuals were recorded visually and aurally. The Grey-cheeked Fulvetta was the most dominant species, accounting for 27.9% of visual observations and 22.2% of total observations (visual and aural detections). Significant relationships were found between the number of visual observations and the number of captures (rs = 0.61, n = 41, p < 0.01), between the number of visual + aural observations and the number of captures (rs = 0.53, n = 41, p < 0.01) and between the number of visual observations and the number of visual + aural observations (rs = 0.94, n = 41, p < 0.01). For 31 species, the relative captures were greater than the relative observations. For the Collared Pygmy Owl (Glaucidium brodiei), the Black-browed Barbet (Megalaima oorti) and the Black-throated Laughingthrush (Garrulax chinensis), the relative capture number was higher than that of visual observation during point counts, but lower than the visual and aural observations combined, indicating that these species are more readily heard than they are either seen or caught by mist nets.
Relationship between activity height and number of captures
Based on point counts for 107 species, activity heights ranged from the ground, for species such as the Blue-rumped Pitta (Pitta soror), the Orange-headed Ground Thrush (Zoothera citrina) and the Golden Mountain Thrush (Zoothera dauma) to 35 m, for species such as the Chestnut Bulbul (Hemixos castanonotus), the Black Bulbul (Hypsipetes leucocephalus) and the Ratchet-tailed Treepie (Temnurus temnurus). Of the 45 species captured, 39 were also detected by point counts, where the activity height of these 39 species ranged from the ground to 17 m, averaging 7.2 ± 0.3 m (n = 697). Most species netted were mainly active below 4 m in height, but in addition there were two small peaks of captured numbers at 8.3 and 12.0 m (Fig. 2). These were mainly White-throated Bulbuls (Alophoixus pallidus, most active at 8–9 m) and Silver-breasted Broadbillds (Serilophus lunatus, 11–13 m). Many individuals of these two species were captured.
![Figure 2. Relationship between activity height and number of birds captured for 39 species recorded for both observations and mist-netting]() Figure 2. Relationship between activity height and number of birds captured for 39 species recorded for both observations and mist-netting
Figure 2. Relationship between activity height and number of birds captured for 39 species recorded for both observations and mist-nettingRelationship between light intensity and number of captures
Light intensities were measured for 180 net-days during October 2001, January and March 2002, and September 2004. Light averaged 2040.6 ± 55.5 lux (n = 4500) and ranged from 1.7 to 19970.0 lux. The number of birds captured for the 180 net-days was significantly correlated with light levels (rs = 0.16, n = 180, p = 0.03) (Fig. 3). The correlation was still significant after deleting the highest point (light intensity: 6564.4 lux, captures: 9 individuals) in Fig. 3 (rs = 0.15, n = 179, p = 0.05).
![Figure 3. Relationship between mean light intensity and number of birds captured for 180 net-day measures (basic unit]() Figure 3. Relationship between mean light intensity and number of birds captured for 180 net-day measures (basic unit "net-day" = per net per day).
Figure 3. Relationship between mean light intensity and number of birds captured for 180 net-day measures (basic unit "net-day" = per net per day).Discussion
Critical to understanding avian abundance and diversity is the availability of comparatively unbiased tools for assessing avian communities. This is particularly important on the island of Hainan where the avifauna is poorly known and under considerable threat from anthropogenic disturbance. One test of the efficacy of a particular survey method is to measure its results against an independent alternative methodology. Congruent results from two or more independent methodologies can indicate that a particular survey method is comparatively unbiased relative to other methods.
Our study at the Jianfengling Forest Area showed a relationship between the number of observations during point counts and the number of mist net captures. Certain species (e.g. the Grey-cheeked Fulvetta) were abundant in both point count surveys and mist net captures, indicating that both techniques provided similar data regarding identification of the most abundant species. The White-throated Bulbul, Rufous-necked Scimitar Babbler (Pomatorhinus ruficollis), Silver-breasted Broadbill, White-bellied Yuhina (Erpornis zantholeuca), Gould's Fulvetta (Alcippe brunnea) and Rufous-capped Babbler (Stachyris ruficeps) were also identified as common species in both mist net and point count surveys. The Dusky Warbler (Phylloscopus fuscatus), Large Scimitar Babbler (Pomatorhinus hypoleucos) and Blue-and-white Flycatcher (Cyanoptila cyanomelaena) were identified as uncommon in both mist net and point count surveys. These data strongly support the conclusion that point counts and mist netting are providing similar measures and comparable data of avian abundance and diversity for some migratory bird species (Wang and Finch, 2002).
However, there were some important differences between mist netting and point count data at Jianfengling. Resmen and Good (1996) pointed out that activity height strongly affects the probability of capture. Our results support this conclusion. The probability of capture was greater than that of observation for ground feeders, among which, the White-crowned Forktail (Enicurus leschenaulti) and Grey Thrush (Turdus cardis) had high capture ratios. In contrast, canopy dwelling corvid and dicrudid species were seldom captured. Other canopy and aerial feeding species were more likely to be observed than captured, examples being the Blue-bearded Bee-eater (Nyctyornis athertoni) and Black-browed Barbet. These results are consistent with results from other avian communities showing that aerial or canopy-foraging species are often missed by mist netting (Ralph et al., 1993; Rappole et al., 1998; Wang and Finch, 2002). However, while mist netting underperforms relative to point counts for canopy species, mist netting is likely more effective than point counts in detecting mid-story species. Whitman et al. (1997) found that in northern Belize mist nets detected a greater proportion of mid-story species than point counts.
The effect of ambient light on the probability of capture has not been studied. Normally, strong light would make it much easier for birds to see the nets and hence avoid capture, which is the rationale behind the practice of early morning (i.e. low-light) mist netting for open country, grassland and shorebirds species. Our data showed a positive correlation between capture number and light intensity. One possibility is that areas of comparatively higher light are typical areas of disturbance and forest edge habitat. Edge specialists are particularly active in these areas since their movements are confined to narrow corridors making them more likely to run into mist nets. In contrast, at low light levels, interior forest species whose activity is less confined to narrow corridors would be less likely to encounter mist nets. Another possibility is that strong light helps birds see their food (e.g. insects) more clearly in forest and that the frequency of catching insects is greater in strong light forests than in dense, dark forests.
For cryptic, nocturnal or crepuscular species or those which infrequently vocalize, point counts are likely to underestimate abundance. Cryptic species such as the Lesser Wren Babbler (Napothera epilepidota), Spot-necked Babbler (Stachyris striolata) and the nocturnal Cuckoo Owl (Glaucidium cuculoides) were more likely to be captured than detected during point counts. Five other species, known from only a very small number of records prior to this survey (Cheng and Tan, 1973; Zeng et al., 1995), were detected by mist netting, i.e., the Red-tailed Robin (Luscinia sibilans), Golden Mountain Thrush, Lesser Wren Babbler, Pale-legged Leaf Warbler (Phylloscopus tenellipes) and Fukien Niltava (Niltava davidi). These results and those from other studies support the conclusion that mist netting is a particularly appropriate technique for sampling species that are difficult to see and seldom vocalize (Terborgh et al., 1990; Wang and Finch, 2002).
Detection by mist nets is affected by a large number of factors, such as habitat heterogeneity, flight distance and frequency (Remsen and Good, 1996). Canopy species are likely to be captured more often in nets among short forest trees than among tall forest trees, even though the species is equally abundant in both habitats (Petit et al., 1992). In other studies, canopy or sub-canopy species were detected by mist net more often in the young forest habitats than in the mature forest habitat (Pagen et al., 2002). Mesh size may also impact capture rate. Piratelli (2003) concluded that 36 mm mesh nets were better than 61 mm mesh nets for most birds. However, for our study site at Jianfengling, mist netting and point counts provided largely congruent results with a few notable exceptions. Robust methods for estimating avian diversity and abundance are especially important in avian communities of subtropical and tropical Asia, as on Hainan Island, where data on threatened populations are sorely needed.
Acknowledgements
We are grateful to the Department of Wildlife Conservation and Management, the Hainan Forest Bureau and the Jianfengling Forest Bureau for permission to conduct fieldwork at the Jianfengling Forest Area. We thank Yayun Wang, Nin Guo and Huanqiang Chen for help during fieldwork. We thank James Van Remsen and Herman Mays for providing helpful comments which improved the manuscript during the editing process and Richard Lewthwaite for proof reading the English manuscript. This study was funded by the Kadoorie Farm and Botanical Garden and the Hong Kong Special Administrative Region, China.
-
![]()
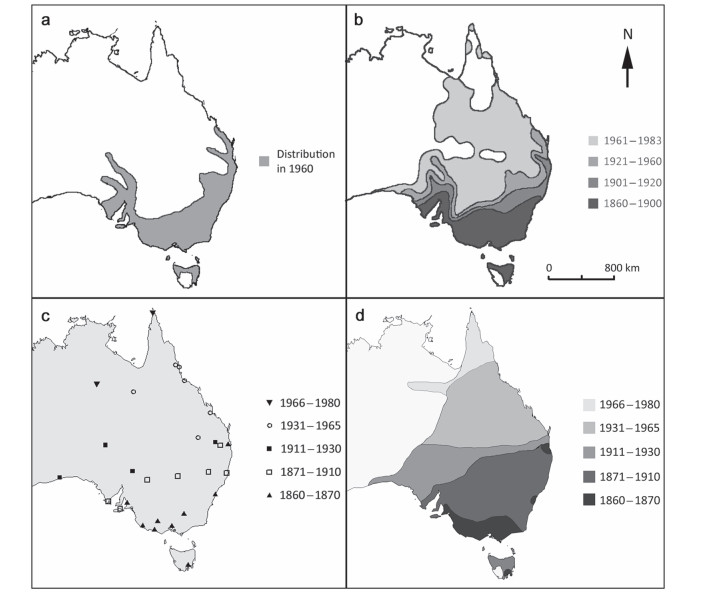
Figure 1. The range expansion of the Australian House Sparrow. The map (a) is a redrawing of a distribution map published by Summers-Smith (1963) which estimated the distribution of Australian House Sparrows in 1960. The map (b) is a redrawing of a map by Jones (1986) which uses multiple sources of information to estimate the distribution of the House Sparrow in Australia at different time points and displays the range growth using contour lines. Jones' 1960 distribution line seems to follow Summers-Smith's distribution. The map (c) was generated from our research which collected the arrival time of House Sparrows in different towns and cities (see Additional file 1: Table S4 for full details). The map (d) uses our arrival points to draw our own contour lines which estimate the species range expansion between different time intervals in a comparable way to Jones (1986)
Table 1 Comparison between recognized summaries of the acclimatisation of bird species
References Location Victoria Adelaide Queensland Sydney Tasmania Source (1) Year (no. of releases) Number of birds (2) 1867 mass release (3) 1863-1865 from England (4) "Failed" 1869 introduction (5) Sent 1863 (6) Unknown number sent in 1860s Ryan (1906) England 1863, 1864, 1866, 1867 and 1872 In total 345 released and one release of unknown size Yes No No Yes Yes Summers-Smith (1963) England 1863, 1864-1872 (many) A large number No No Yes Large number Yes Long (1981) England and sparrows from China and Java 1863 (2), 1864, 1866, 1867 and 1872 Same as Ryan with additional numbers for the importations in 1863 Yes Yes Yes No Yes HANZAB (Higgins et al. 2006) Mostly England but also China and Java 1863, 1864, 1865, 1866, 1867 and 1872 In total 473 released and one unknown release Yes Yes Yes Yes Yes Jenkins (1977) England 1863 (4) In total 130 released Yes Yes Yes No Yes Balmford (1981) England 1863 (2) In total 65 released No NA NA NA NA Newsome and Noble (1986) Not clear 1860s > 100 No No No No No Lever (2005) Suggests England 1863 (2), 1864, 1865, 1866, 1867 and 1872 In total 351 released and one unknown release Yes Yes Yes Yes Yes Anderson (2006) England and western Europe 1863 (3), 1864 -1872 (many) Not mentioned No Yes Yes Yes Yes Andrew and Griffith (the present paper) England, India and Germany 1863 (2), 1864 (2), 1865 and 1867 (many) Approx. 90-130 birds imported and at least 161 released Yes, possibly at 17 locations 1 bird in 1863 and one-third of a shipment in 1865 Did not fail, birds liberated in 1869 and 12 birds from VIC in 1868 Yes, at least 6 birds purchased by NSW society At least 15 birds sent to Hobart in 1867 Here we summaries the facts reported by these sources. There are six commonly reported details: (1) the number and date of importation/liberations in Victoria, (2) the large number of liberations across Victoria in 1867, (3) an unknown number of birds shipped to Adelaide, (4) the "failed" introduction to Queensland in 1869, (5) the small number of birds sent to Sydney and (6) birds being sent to Tasmania. A summary of what sources these texts used is shown in Additional file 1: Table S6  下载: 导出CSV
Table 2 Summary of the House Sparrow's introduction to Australia
Import/liberation Introduced to Time Origin of birds Number of sparrows Reference Failed import Melbourne Botanic Gardens 1860 England, sent by Edward Wilson Failed shipment of unknown size Courcy (2003) Failed import Melbourne Botanic Gardens February 1861 England, sent by Edward Wilson on The Norfolk 108 birds perished NA 2 Failed import Melbourne Botanic Gardens 1862 England, on The Suffolk 60 birds perished Jenkins (1977) Import Melbourne, VIC November 1862 India, first sparrows from India 11 Indian sparrows out of many NA 4 Import Melbourne Botanic Gardens January 1863 England, on the Princess Royal 19 sparrows out of many Le Souef (1958); NA 9 Failed import Melbourne, VIC Sent April 1863 Ceylon, Sent by Mr. Layard Unknown size possible failed NA 14 Import Melbourne, VIC June 1863 Calcutter India, Sent by Mr. Butler 2 Indian sparrows out of many NA 17 Import Pentridge Stockade, Victoria June 1863 England, on The Relief 130-160 small birds many sparrows, 30-40 sparrows given to Colonel Champ Hardy (1928), Le Souef (1958) and Long (1981); NA 16 Failed import Melbourne, VIC July 1863 Unknown starting port, on The Ceres 250 small birds including sparrows drowned NA 18 Import Adelaide, South Australia July 1863 England, by Captain Harris 1 survivor from the shipment NA 21 Liberation Melbourne Botanic Gardens September 1863 Could include birds from all shipments as well as tree sparrows and java sparrows 80 birds released Le Souef (1958) Import Melbourne, VIC September 1863 Leipsic Germany, on The Star 1 survivor out of 160 birds NA 22 Liberation Pentridge Stockade, Victoria October 1863 Sparrows given to Colonel Champ from The Relief 30-40 Hardy (1928), Le Souef (1958) and Long (1981) Liberation Boroondara, Victoria 1864 Acclimatisation Society of Victoria A small number Le Souef (1958) Liberation Ballarat, Victoria April 1864 Annual meeting of the Victorian Acclimatisation Society 1864 22 birds NA 28 Import/liberation The Sydney Botanic Gardens 1863-1864 Acclimatisation Society of Victoria Birds purchased: 2 in 1863 and 4 in 1864 Bennett (1864) and Leishman (1997); NA 24, 27 and 30 Liberation Ballarat, Victoria 1865 Acclimatisation Society of Victoria Unknown Le Souef (1958) Liberation Murrundi, NSW June 1865 Unknown Three males and three females NA 32 Import Adelaide, South Australia July 1865 England, on The Orient One-third of the birds survived the trip. Sutton (1935) and Condon (1951); NA 33 Failed import Brisbane, Queensland April 1866 London, from the British Acclimatisation Society Failed shipment of 22 sparrows NA 35 Failed import Melbourne, VIC Sent June 1866 Vienna, Austria Failed shipment of unknown size NA 37 Liberation Across the State of Victoria (see Additional file 1: Table S3 for locations) 1867 Acclimatisation Society of Victoria Unknown number of birds released at most sites. Five birds were released at Ballarat and 14 at Ararat (Sage 1957). Probably similar numbers at other locations. Ryan (1906), Tarr (1950), Sage (1956), Le Souef (1958), Rolls (1969) and Long (1981); NA 43, 44 Liberation Hobart, Tasmania June 1867 Acclimatisation Society of Victoria 15 Le Souef (1958); NA 40, 41 Import Geelong, VIC July 1867 Unknown Unknown NA 42 Liberation Mount Gambier, SA April 1868 Probable Adelaide Unknown NA 45 Liberation Bowen Park, QLD July 1868 Acclimatisation Society of Victoria 12 NA 46 Import Queensland May 1869 England, on The Flying Cloud Unknown number released Chisholm (1919) and Jenkins (1977); NA 49, 51 Liberation Launceston, Tasmania 1870s Unknown, Littler (1901) suggests the birds were from Adelaide Unknown Littler (1901); NA 60, 61, 62 This table shows a chronological order to events identified by our systematic review of the House Sparrow's introduction. The table includes failed importations, importations and liberations of sparrows (see full details in Additional file 1: Tables S2 and S3)
下载: 导出CSV
-